Glencore’s ASX listing through CHESS Depositary Interests (CDIs) has given ASX only investors with direct access to another global diversified miner with growing exposure to copper, the industrial metal at the forefront of global electrification. Copper is forecast to increase from around one-third of Glencore’s earnings (EBITDA) in FY26 to more than half by the early 2030s, supported by projects across South America and Central Africa, alongside optimisation of existing operations including Collahuasi, Antapaccay and Katanga/KCC – in other words, its profile is evolving like BHPs over the coming years, a factor we like.
However, despite this growth outlook, as mentioned, GLC trades at a discount to BHP and RIO, with FY27–FY28 estimated EV/EBITDA of around 5x, compared with its long-term average of approximately 7x and multiples in the mid-to-high 8x range for its Australian peers. There is undoubtedly a good argument for this valuation gap to be slowly addressed through 2026/7:
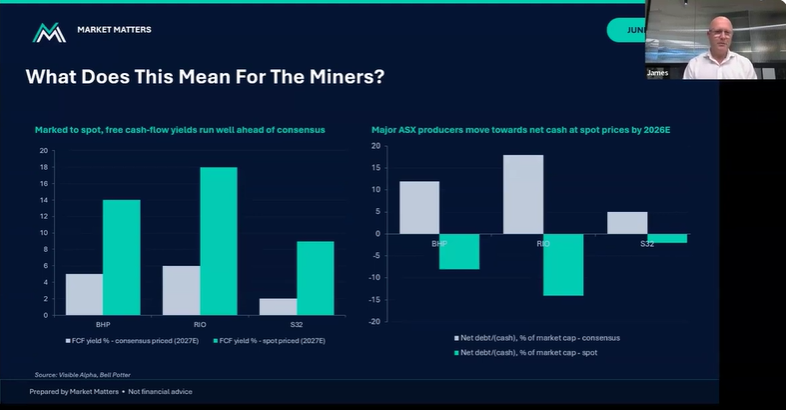
- GLC’s return on invested capital (ROIC) is set to recover above 20% as major investment spending moderates, copper volumes increase and free cash flow (FCF) strengthens – FCF yield, which measures how much free cash flow a company generates relative to its market capitalisation is forecast to approach 8% as the business moves through FY27–FY28. FCF is a useful valuation metric for assessing how cheaply a company is trading relative to the cash it produces.
A key business differentiator is Glencore’s Marketing/Trading division, which contributes around 30% of estimated FY26 earnings. Its trading and marketing activities provide a distinct earnings stream that can help diversify cash generation during periods of commodity market volatility. However, this division is comparatively difficult to value, contributing to the discount at which Glencore trades relative to its peers.
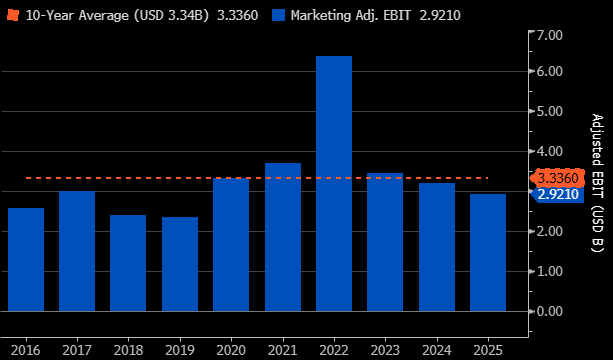
- Importantly, GLEN’s marketing/trading division has never reported a loss, delivering positive adjusted EBIT in every year on record. It has now achieved 18 consecutive years of positive results, with average annual EBIT exceeding US$3 billion, highlighting the resilience and consistency of this earnings stream.
The chart below illustrates the recent 10 years, with the division consistently tracking at or above the top of Glencore’s own $2.3–$3.5B guidance range across most years – arguably not a reason to depress a valuation!
chart

Glencore Marketing Division – Adjusted EBIT – Source: Bloomberg
chart
Glencore Marketing Division – Adjusted EBIT – Source: Bloomberg
Overall, all three miners are positioning for a more copper-intensive future, but their near-term cash flow drivers differ. BHP and RIO continue to benefit from their established iron ore franchises, while Glencore offers a potentially attractive combination of copper growth, marketing/trading earnings, and valuation discount. Its ASX listing, at the very least, gives local investors another large diversified mining exposure with a strong medium- to long-term production growth outlook.