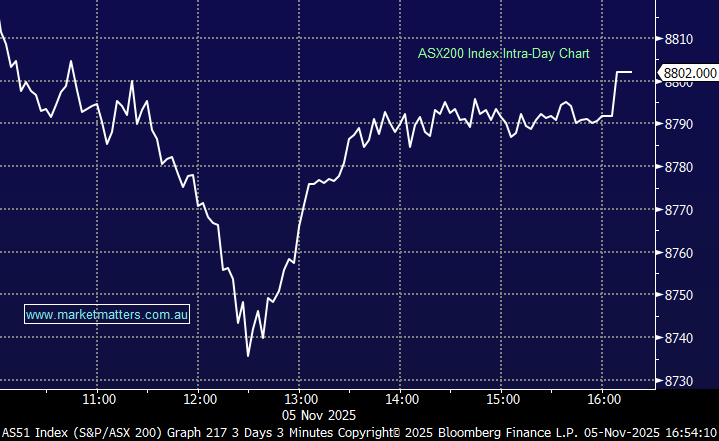
Volatility is certainly back in town with the VIX jumping +9.7% in the US on Friday as their Banking Sector tumbled -11.5% over the week, understandably far worse than our own which slipped just -1%. Similarly, the ASX200 ended last week down just -1.6% with all of the damage unfolding on Friday as the SVB news reverberated through financial markets. The loser’s corner last week was dominated by the resources while the tech names remained firm, this week is likely to commence with another period of reversion, at least on Monday:
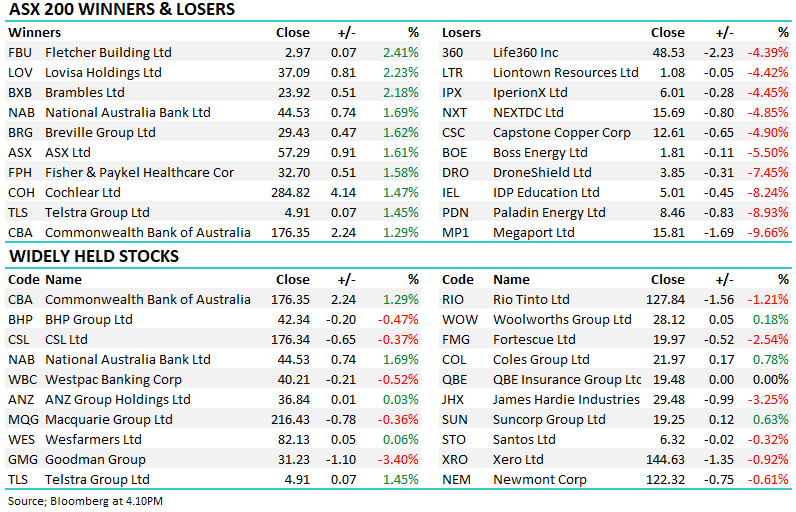
Winners: Xero Ltd (XRO) +14.7%, REA Group (REA) +2%, SEEK (SEK) +1.4%, and, Altium (ALU) +0.4%.
Losers: Sandfire Resources (SFR) -12.7%, South32 (S32) -9%, IGO Ltd (IGO) -7.6%, RIO Tinto (RIO) -7.2%, and BHP Group (BHP) -6.9%.
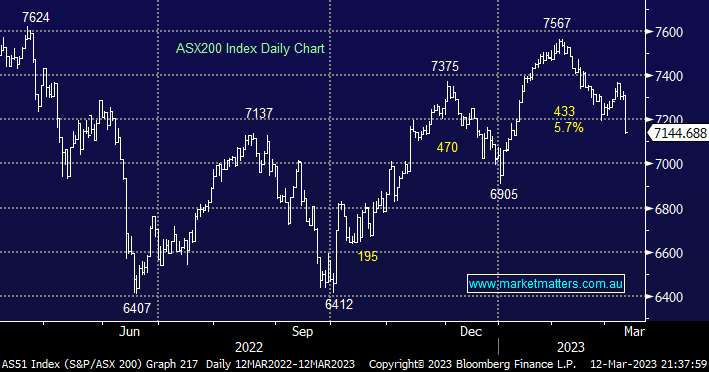
Following the SVB collapse and subsequent banking weakness in the US a test of the 7000 area by the ASX200 wouldn’t surprise but after migrating down the risk curve post-Christmas we remain cautious buyers of weakness.
MM is now neutral towards the ASX200 around 7150
Add To Hit List

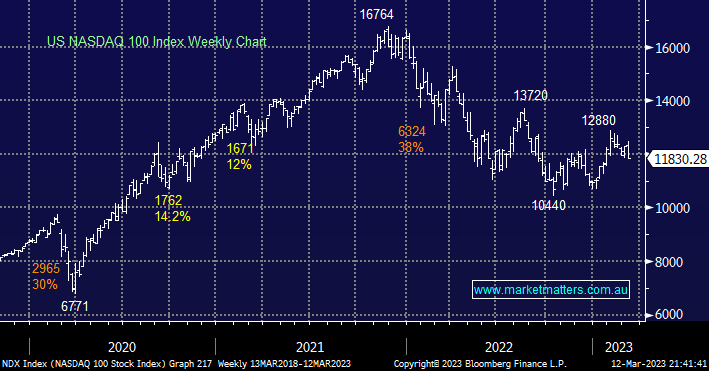
On Friday US stocks continued to tumble following the news of SVB’s collapse but we should remain aware that a bailout/buyout of sorts is a strong possibility over the coming week (s) which is likely to eventually support stocks hence we are looking for opportunities in certain pockets of the market.
- In our opinion if the US NASDAQ 100 can weather the SVB storm this week it will remain on track to test the 13,500 area, or ~10% higher.
MM remains mildly bullish on US tech over the coming months
Add To Hit List
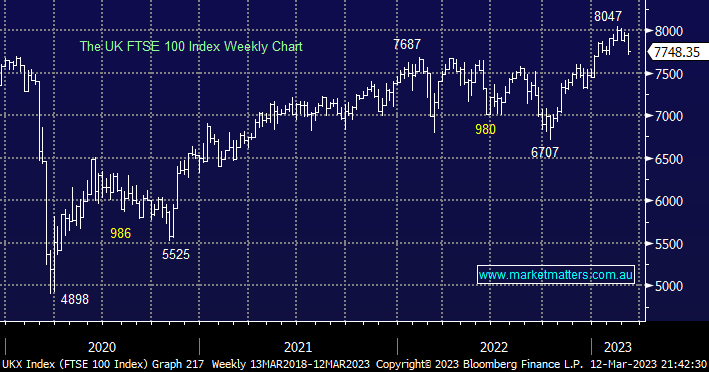
European stocks remain extremely strong despite ongoing macro-economic concerns and now a US banking wobble but as we often say “don’t fight the tape” and at this stage, the trend remains bullish.
- The FTSE still looks capable of making fresh highs above 8,000 over the coming months.
MM remains mildly bullish on European indices
Add To Hit List