Displays share price activity. Volume = number of shares traded, Turnover = value of shares traded, VWAP = volume-weighted average price for the day, sourced from Morningstar.
Last (Price)
15.33
Change
▲ 0.03 (0.20)
Bid / Ask
15.25 - 15.33
Volume
27,526
Turnover
421,582
Open
15.28
Day Range
15.28 - 15.37
VWAP
15.32
Prev Close
15.30
Last Trade
02/11 3:58pm
Fund profile
Displays who issues the fund, how it is structured and invests, its Morningstar category and benchmark, size, headline costs and dates, sourced from Morningstar. Fund size counts every class of the fund; ETF net assets is this listing alone.
Fund size
$302.1M
OCT 2026
Total cost ratio
0.45%
per year
Distributions
Semi-Annually
Since inception
7.3 yrs
JUL 2019
Legal name
BetaShares FTSE 100 ETF
Issuer
BetaShares Capital Ltd
Type
Exchange-Traded Fund
Structure
Open Ended Investment Company
Management style
Index fund
Morningstar category
Equity World Other
Category index
MSCI World Ex Australia NR AUD
Benchmark
FTSE 100 PR AUD
ETF net assets
$302.1M
Units on issue
28.4M
Management fee
0.38% p.a.
Domicile
Australia
Base currency
AUD
ISIN
AU0000051054
Inception
12 JUL 2019
Listed
16 JUL 2019
Index provider
FTSE International Ltd Index
Objective and strategy
The Index is designed to track the performance of the 100 largest U.K. companies by market capitalisation traded on the London Stock Exchange.
There is no assurance or guarantee that the returns of the Fund will meet its investment objective.
Asset allocation · 30 SEP 2026
Displays how the fund is split between shares, bonds, cash and other assets, sourced from Morningstar.
US equity 1.02%Non-US equity 96.92%
Asset class
Net %
Long %
Short %
Equity
97.94
97.94
0.00
Bond
-0.10
0.54
0.63
Cash
0.61
0.64
0.03
Other
1.55
1.55
0.00
Sector exposure
Displays the share of the fund held in each sector, sourced from Morningstar.
Cyclical 39.56%Sensitive 29.71%Defensive 30.73%
Financial Services
26.13%
Industrials
14.10%
Consumer Defensive
13.72%
Healthcare
12.23%
Energy
12.20%
Basic Materials
7.83%
Utilities
4.78%
Consumer Cyclical
4.57%
Communication Services
2.38%
Technology
1.04%
Real Estate
1.03%
Region exposure
Displays the share of the fund held in each region, sourced from Morningstar.
Developed markets 99.70%Emerging markets 0.30%
United Kingdom
93.66%
Europe Developed
3.81%
Asia Developed
1.12%
North America
1.06%
Latin America
0.25%
Asia Emerging
0.05%
Japan
0.05%
Africa / Middle East
0.00%
Europe Emerging
0.00%
Australasia
0.00%
Country exposure
Displays the twelve countries the fund holds most of, sourced from Morningstar.
United Kingdom
93.66%
Switzerland
2.63%
United States
1.04%
Hong Kong
0.96%
Ireland
0.89%
Mexico
0.21%
Greece
0.19%
Taiwan
0.11%
Japan
0.05%
China
0.04%
Netherlands
0.04%
Brazil
0.04%
Style box
Displays where the fund's shareholdings sit on Morningstar's style box: size (large, mid, small) down and investment style (value, blend, growth) across, sourced from Morningstar.
LargeMidSmallValueBlendGrowth
Style
Large Blend
Average moat
Narrow
Size score
300
SmallMidLarge
Value-growth score
135
ValueBlendGrowth
Economic moat
None 35%Wide 34%Narrow 31%
Market capitalisation
Displays the share of the fund's shareholdings in giant, large, mid, small and micro cap companies, sourced from Morningstar.
Giant
56.06%
Large
30.33%
Mid
13.31%
Small
0.29%
Micro
0.01%
Giant 56%Large 30%Mid 13%Small 0%Micro 0%
Average market cap
$116.36B
Number of holdings
100
Shares held
92
Portfolio statistics · 30 SEP 2026
Displays the valuation, yield, size, concentration and quality of the fund's shareholdings taken together (trailing twelve months), sourced from Morningstar.
Price / earnings
16.37
Price / book
2.21
Price / sales
1.42
Price / cash flow
9.05
Dividend yield
3.13%
Assets in top 10
49.51%
Return on equity
21.94%
Net margin
15.96%
Earnings growth (3 yr)
6.36%
Top holdings · top 10 = 49.51% of assets
Displays the fund's ten largest holdings and their weight in the portfolio, sourced from Morningstar.
Holding
% Weight
First bought
Market value
Currency
Units held
Sector
Country
HSBC Holdings PLC HSBA
10.20
JUL 2019
43.4M
GBP
1.5M
Financial Services
United Kingdom
Shell PLC SHEL
8.28
APR 2022
35.2M
GBP
516,271
Energy
United Kingdom
AstraZeneca PLC AZN
7.31
JUL 2019
31.1M
GBP
132,579
Healthcare
United Kingdom
Rolls-Royce Holdings PLC RR.
4.87
JUL 2019
20.7M
GBP
741,754
Industrials
United Kingdom
Unilever PLC ULVR
3.80
JUL 2019
16.2M
GBP
183,786
Consumer Defensive
United Kingdom
BP PLC BP.
3.42
JUL 2019
14.5M
GBP
1.4M
Energy
United Kingdom
British American Tobacco PLC BATS
3.33
JUL 2019
14.1M
GBP
179,459
Consumer Defensive
United Kingdom
Rio Tinto PLC Ordinary Shares RIO
2.92
JUL 2019
12.4M
GBP
91,489
Basic Materials
United Kingdom
GSK PLC GSK
2.90
JUL 2019
12.3M
GBP
352,625
Healthcare
United Kingdom
Lloyds Banking Group PLC LLOY
2.48
JUL 2019
10.6M
GBP
5.2M
Financial Services
United Kingdom
Trailing returns · 30 SEP 2026
Displays total returns after fees at net asset value, the return at the ASX market price, the return before fees, and where the fund ranks among funds in its Morningstar category, sourced from Morningstar.
Fund (NAV)Market price
1M
-4.0
3M
1.8
6M
6.4
YTD
7.8
1Y
14.9
3Y
18.3
5Y
11.4
Period
Fund (NAV) %
Market price %
Before fees %
Rank in category
1 month
-3.98
-3.56
-3.95
—
3 months
1.79
1.69
1.90
—
6 months
6.42
7.85
6.66
—
Year to date
7.79
8.62
8.15
—
1 year
14.93
15.88
15.45
—
3 years p.a.
18.30
18.24
18.84
—
5 years p.a.
11.44
11.28
11.94
—
Returns to 30 SEP 2026, periods of 3 years and longer annualised. Rank is the percentile in the Morningstar category at 30 SEP 2026 (1 = best) over the funds ranked.
Calendar year returns
Displays the total return after fees and the capital (price) return for each calendar year, with the fund's rank in its Morningstar category, sourced from Morningstar.
TotalCapital
2020
-16.5
2021
24.1
2022
-2.3
2023
16.5
2024
17.5
2025
25.9
Year
Total %
Capital %
Rank in category
2025
25.91
21.03
—
2024
17.47
14.10
—
2023
16.46
9.67
—
2022
-2.34
-3.92
—
2021
24.13
21.43
—
2020
-16.48
-18.93
—
Financial year returns
Displays the total return after fees for each financial year to 30 June, sourced from Morningstar.
FY21
20.3
FY22
1.2
FY23
17.3
FY24
11.2
FY25
22.3
FY26
12.7
Financial year
Total %
Financial year to date
1.36
Year to 30 JUN 2026
12.68
Year to 30 JUN 2025
22.26
Year to 30 JUN 2024
11.23
Year to 30 JUN 2023
17.31
Year to 30 JUN 2022
1.16
Year to 30 JUN 2021
20.35
Risk statistics · 30 SEP 2026
Displays how the fund has moved relative to its category index: alpha (return beyond the index), beta (sensitivity to it), R-squared (how much the index explains), volatility and risk-adjusted returns, sourced from Morningstar.
1 year
3 years
5 years
10 years
Alpha
4.70
6.82
4.62
—
Beta
0.14
0.28
0.45
—
R-squared
2.52
11.91
25.77
—
Standard deviation
14.13
11.78
14.64
—
Sharpe ratio
0.69
1.37
0.93
—
Sortino ratio
1.04
2.77
1.60
—
Tracking error
11.02
9.90
10.11
—
Information ratio
-0.04
-0.33
-0.05
—
Upside capture %
27.50
51.82
59.61
—
Downside capture %
-51.04
-24.65
20.22
—
Maximum drawdown %
-4.25
-4.25
-13.01
—
Measured against MSCI World Ex Australia NR AUD with RBA Bank accepted Bills 90 Days as the risk-free rate, to 30 SEP 2026. Maximum drawdown is on gross returns at the latest quarter end.
Portfolio risk score
Displays Morningstar's Portfolio Risk Score for the fund's holdings, how closely the ETF tracks its index day to day, the estimated cost of holding it against the index, the cost of trading it at market size, and its best and worst quarters since inception, sourced from Morningstar.
Risk score
90.3
Cash 0
Global shares 100
Morningstar Portfolio Risk Score at 30 SEP 2026.
Market impact cost %
0.239
Best quarter
12.11% · JAN 2021
Worst quarter
-19.57% · APR 2020
Fees and costs
Displays the fund's ongoing costs as a percentage of assets per year: the PDS management fees and costs, performance fee and transaction costs that make up the total cost ratio (the RG 97 forward estimate, and what was charged last financial year), and the buy / sell spread, sourced from Morningstar.
Management fees and costs
0.45% p.a.
Transaction costs
0.03% p.a.
Total cost ratio
0.45% p.a.
Total cost ratio (last FY)
0.45% p.a.
Performance fee
Not Disclosed
PDS dated
16 SEP 2022
Distributions
Displays the most recent distribution paid per unit and its key dates, sourced from Morningstar.
Latest distribution
0.3390
Ex Date
1 JUL 2026
Record Date
2 JUL 2026
Pay Date
16 JUL 2026
NAV at ex date
14.96
Paid this year
0.5199
Distributions by year
Displays the total distributions paid per unit in each calendar year, sourced from Morningstar.
2024
0.5
2023
0.4
2022
0.3
2021
0.3
2020
0.2
2019
0.2
Year
Per unit ($)
2024
0.4674
2023
0.4333
2022
0.3383
2021
0.3330
2020
0.2229
2019
0.2121
Distribution history
Displays the most recent distributions by ex date, sourced from Morningstar.
Ex Date
Per unit ($)
1 JUL 2026
0.3390
2 JAN 2026
0.1809
1 JUL 2025
0.3057
2 JAN 2025
0.1617
1 JUL 2024
0.2380
2 JAN 2024
0.1953
3 JUL 2023
0.1748
3 JAN 2023
0.1635
1 JUL 2022
0.1654
4 JAN 2022
0.1675
1 JUL 2021
0.1459
4 JAN 2021
0.0770
Sustainability rating · 31 AUG 2026
Displays the Morningstar Sustainability Rating (1 to 5 globes, more is better) and the portfolio ESG risk score behind it (lower is less risk), against the average of the fund's global category, sourced from Morningstar and Sustainalytics.
Average
ESG risk score
19.56
NegligibleLowMediumHighSevere
Category average 18.76
Rank in category
68th percentile of 350 funds
Environmental risk
6.80
Social risk
9.23
Governance risk
3.52
Portfolio covered
99.7%
ESG risk of holdings
Displays the share of the covered portfolio held in companies with negligible, low, medium, high and severe ESG risk, sourced from Morningstar and Sustainalytics.
Negligible
3.79%
Low
60.05%
Medium
25.11%
High
10.92%
Severe
0.13%
13.08% of assets are in companies with high or severe controversies.
Carbon · 31 AUG 2026
Displays the portfolio carbon risk score (lower is less exposure to the transition to a low-carbon economy), the share of the portfolio in companies with fossil fuel revenue, and whether the fund earns Morningstar's Low Carbon Designation, sourced from Morningstar and Sustainalytics.
Carbon risk score
10.55
LowMediumHighSevere
Category average 9.07
Carbon risk
Medium Risk
Rank in category
61st percentile of 55 funds
Fossil fuel involvement
18.94%
Category average
5.26%
Low Carbon Designation
No
Portfolio covered
99.6%
Tenure
Displays how long the managers have run the fund: the average and longest tenure, who has served longest, the latest appointment and how many other funds the team manages, sourced from Morningstar.
Number of managers
0
Other funds managed
0
Displays all company announcements released by the company to the exchange, sourced from Morningstar.
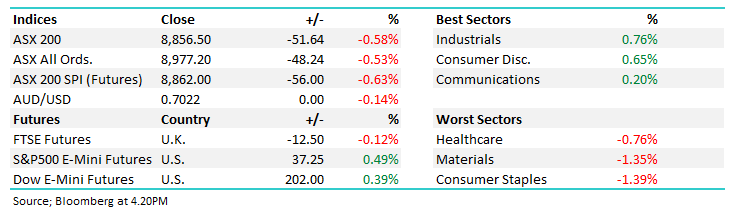
The FTSE pushed +0.8% higher overnight, taking it within 1% of its all-time high. The UK index is one MM watches as a leading indicator for the ASX, and both remain on track to post new all-time highs in 2026, with the ASX positioned for some major performance catch-up; perhaps today's CPI will be the catalyst.
The FTSE 100 index was notably more resilient than its European and Asian peers last week, benefiting from its defensive, energy, and financials-heavy composition which acted as a natural hedge against the AI-driven tech rout. The +2.0% weekly gain was driven primarily by energy strength, sterling weakness, and selective earnings beats which took the index to a fresh 10-week closing high despite all of the geopoloitical uncertainty.
European indices pushed higher overnight, aided by the anticipated 0.25% rate cut by the ECB; due to sluggish economic growth in the region, another three such cuts are expected through 2025.
The ASX200 was whacked on Thursday and Friday after the Fed Minutes weighed on equities in general, but especially the miners, as gold and copper surrendered some of their recent gains - Copper fell 8%, and gold fell almost 5% into the weekend. However, we believe this is a pullback in both commodities and related stocks to buy, which should eventually help the local market's performance compared to its global peers.
April witnessed a bearish move by bonds and equities, driven by escalating interest rate fears as “sticky inflation” became a regularly used catchphrase across financial markets. Conversely, so far in May, we’ve witnessed a complete reversion in the market's thinking/pricing for the future path of interest rates after both the Fed and RBA left rates on hold and delivered less hawkish rhetoric than many feared. Also, for good measure, markets embraced the recent “goldilocks” US employment data, which was a miss on job creation, while monthly wage growth slipped 0.2% from March; the latter was the number that caught most people's attention.
US indices experienced a quiet session overnight due to a dearth of news compared to the last few weeks, but the bullish takeout is that the broad-based S&P500 still closed higher. Quarterly reporting threw up some mixed results, with UBS Group (UBS US) up over 7% on very strong earnings while Ferrari (RACE US) slid 6% on an earnings miss.
The ASX200 rallied +0.7% higher last week as easing bond concerns saw the rate-sensitive stocks/sectors recover strongly, e.g. The Real Estate +3.2%, Tech +2.3%, and Consumer Discretionary +2.1% sectors advanced strongly. After Fridays market friendly employment data, we expect more of the same at the start of the second week of May, aided by a more than 3% surge by US Tech following Apple’s(AAPL US) earnings beat – the US2.8 trillion dollar stock surged almost 6%.
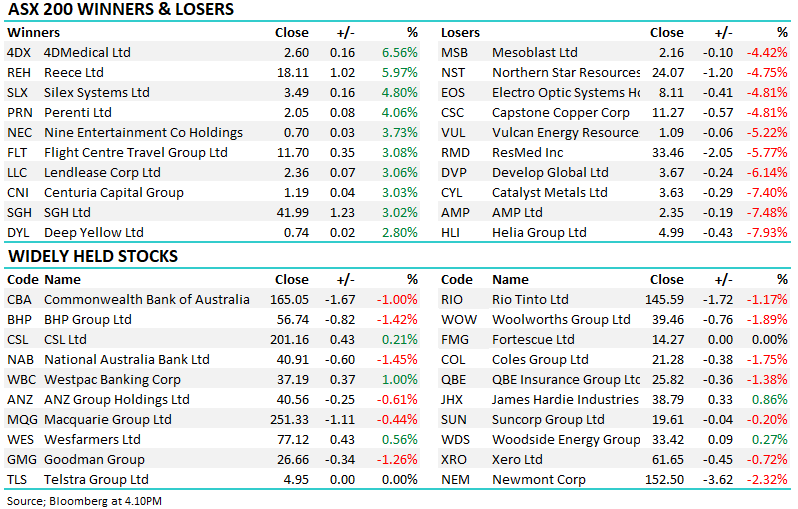
The ASX200 closed higher last week, although it didn't feel like it after Friday's 1.4% unwind, which saw over 80% of the main board close in the red - BHP accounted for around 30% of the index's loss. At this stage, we are 50-50 as to the market's next 150 points, which is not a common stance for MM; we are usually far more committed! We are still in “Buy Mode”, carrying reasonable cash levels, looking for optimum entry points, ideally a little lower for stocks we’ve been flagging in recent reports.
US stocks recovered strongly from their initial aggressive sell-off following the META result and, significantly, average guidance. If we exclude last night's tough tech session, it was a balanced session for US stocks, with 5 of the main 11 sectors closing higher, led by the resources, which should bode well for the likely names ex-BHP. Reporting season is delivering its usual volatility under the hood, but we don’t see any major concerns at the index level.
Betashares FTSE 100 ETF (F100) is a exchange traded fund incorporated in Australia. The Fund aims to track the performance of the FTSE 100 Index, before taking into account fees and expenses.
Check your email for an email from [email protected]
Subject: Your OTP for Account Access
This email will have a code you can use as your One Time Password for instant access
Verication email sent.
Check your email for an email from [email protected]
Subject: Your OTP for Account Access
This email will have a code you can use as your One Time Password for instant access
!
Invalid One Time Password
Please check you entered the correct info, please also note there is a 10minute time limit on the One Time Passcode
To reset your password, enter your email address
A link to create a new password will be sent to the email address you have registered to your account.
Something went wrong. Please try again in a moment.
You're trying to view member-only content
Market Matters members receive daily market reports, real-time trade alerts, full access to 5 portfolios and dynamic company data.
Choose how you'd like to proceed:
We have a range of membership options to suit your needs and budget, why not join today and get unlimited access to the premium Market Matters service.