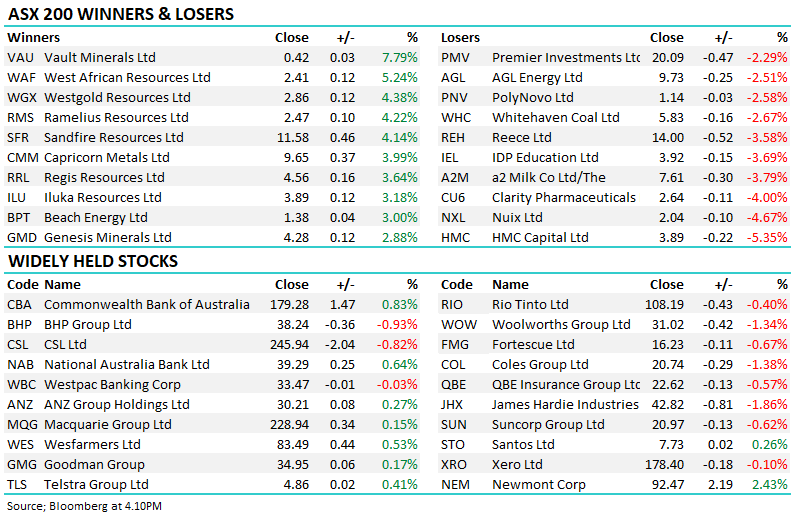
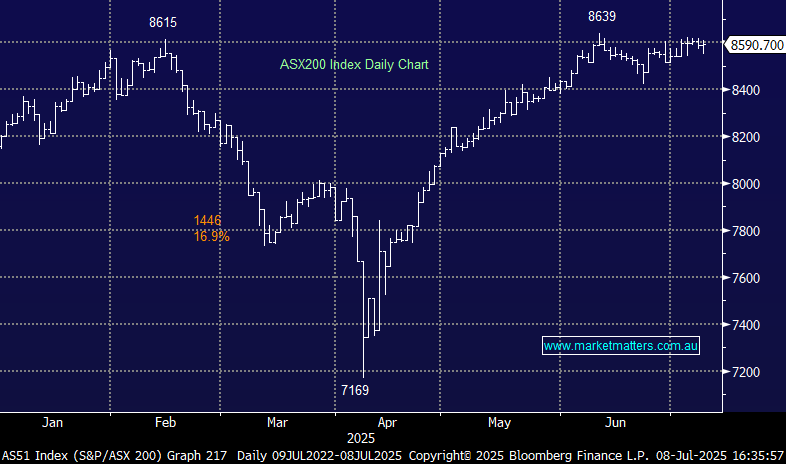
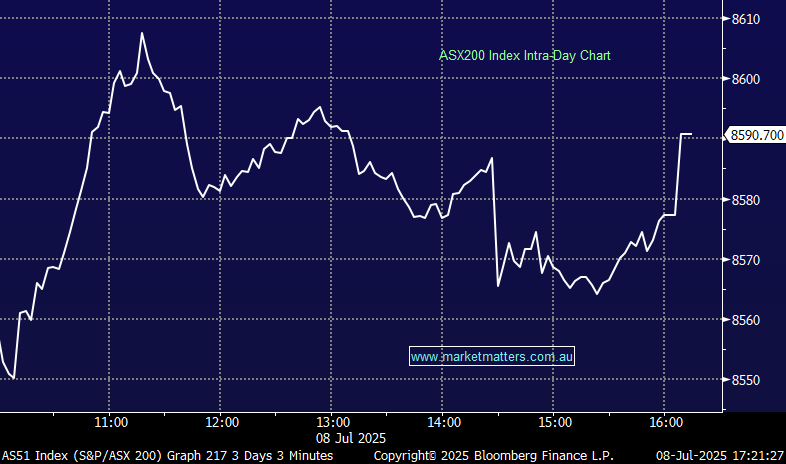
This morning, the ASX200 is poised to test its previous resistance level, which capped it throughout 2024 before this month’s surge above 8000; let’s hope the bullish move doesn’t prove short-lived. By definition, once the market broke out above 7900, it went from resistance to support from a technical perspective. However, at MM, we focus more on the stocks and sectors than the index itself, but we must be mindful of whether the general market is in a risk-on or risk-off position. If the ASX200 closes below 7850, we will adopt a defensive stance, giving more credence to the potential that the move towards 8100 was a “false pop” on the upside.
- The SPI Futures are pointing to a drop of -0.8% this morning, taking the ASX200 back towards 7900 major support – Biden’s withdrawal might throw some extra volatility into the mix.
The S&P500 posted its worst week since April, falling -2%, as tech stocks tumbled ahead of this week’s major earnings reports; the NASDAQ was the weakest major index, falling -3.7%. As mentioned earlier, the week was defined by a rotation out of this year’s mega-cap winners in favour of smaller names. Interestingly, while investors/traders refrained from buying the dip by tech stocks, they did wade into call options, suggesting they hadn’t given up hope but wanted to limit their downside risk ahead of this week’s major releases.
- In June, our target areas for US indices were achieved, leading MM to adopt a neutral stance that looks on-point as tech stocks “wobble.”
The Japanese Nikkei has followed the MM exceptionally well in 2024, but if we are correct, the next 10-15% pullback has started to unfold. This is a bad read-through for global equities as we head into the infamous August and September, although the Nikkei often follows in the footsteps of the Yen rather than international equities.
- We can see the Nikkei testing the 36,000 area as the Yen bounces, i.e. another 10% lower.


