Displays share price activity. Volume = number of shares traded, Turnover = value of shares traded, VWAP = volume-weighted average price for the day, sourced from Morningstar.
Last (Price)
74.27
Change
▲ 0.44 (0.60)
Bid / Ask
74.27 - 74.30
Volume
482,665
Turnover
35,917,374
Open
74.10
Day Range
74.10 - 74.60
VWAP
74.41
Prev Close
73.83
Last Trade
13/11 4:17pm
Fund profile
Displays who issues the fund, how it is structured and invests, its Morningstar category and benchmark, size, headline costs and dates, sourced from Morningstar. Fund size counts every class of the fund; ETF net assets is this listing alone.
The Fund seeks to achieve its objective by tracking the performance of the S&P 500® Net TR Index (AUD).
Asset allocation · 30 SEP 2026
Displays how the fund is split between shares, bonds, cash and other assets, sourced from Morningstar.
US equity 99.43%Non-US equity 0.48%
Asset class
Net %
Long %
Short %
Equity
99.91
99.91
0.00
Bond
0.00
0.00
0.00
Cash
0.09
0.24
0.15
Other
0.00
0.00
0.00
Sector exposure
Displays the share of the fund held in each sector, sourced from Morningstar.
Cyclical 25.50%Sensitive 57.04%Defensive 17.46%
Technology
37.01%
Financial Services
12.38%
Healthcare
10.41%
Consumer Cyclical
9.66%
Communication Services
8.82%
Industrials
7.70%
Consumer Defensive
4.96%
Energy
3.51%
Utilities
2.09%
Real Estate
1.85%
Basic Materials
1.61%
Region exposure
Displays the share of the fund held in each region, sourced from Morningstar.
Developed markets 99.86%Emerging markets 0.14%
North America
99.52%
Europe Developed
0.31%
Asia Emerging
0.10%
Latin America
0.04%
United Kingdom
0.03%
Europe Emerging
0.00%
Africa / Middle East
0.00%
Japan
0.00%
Australasia
0.00%
Asia Developed
0.00%
Country exposure
Displays the twelve countries the fund holds most of, sourced from Morningstar.
United States
99.52%
Switzerland
0.27%
China
0.10%
Mexico
0.04%
Ireland
0.04%
United Kingdom
0.03%
Style box
Displays where the fund's shareholdings sit on Morningstar's style box: size (large, mid, small) down and investment style (value, blend, growth) across, sourced from Morningstar.
LargeMidSmallValueBlendGrowth
Style
Large Blend
Average moat
Wide
Size score
278
SmallMidLarge
Value-growth score
136
ValueBlendGrowth
Economic moat
Wide 65%Narrow 25%None 9%
Market capitalisation
Displays the share of the fund's shareholdings in giant, large, mid, small and micro cap companies, sourced from Morningstar.
Giant
43.97%
Large
34.94%
Mid
19.98%
Small
1.11%
Micro
0.00%
Giant 44%Large 35%Mid 20%Small 1%
Average market cap
$723.49B
Number of holdings
6
Shares held
0
Portfolio statistics · 12 NOV 2026
Displays the valuation, yield, size, concentration and quality of the fund's shareholdings taken together (trailing twelve months), sourced from Morningstar.
Price / earnings
23.44
Price / book
5.05
Price / sales
3.51
Price / cash flow
16.31
Dividend yield
1.09%
Assets in top 10
99.97%
Return on equity
37.42%
Net margin
24.52%
Earnings growth (3 yr)
18.13%
Top holdings · top 10 = 100.02% of assets
Displays the fund's ten largest holdings and their weight in the portfolio, sourced from Morningstar.
Holding
% Weight
First bought
Market value
Currency
Units held
Sector
Country
iShares Core S&P 500 ETF 0JFF
100.04
—
14.71B
USD
13.6M
—
United States
USD - Spendable Cash
-0.14
—
-20.9M
USD
14.7M
—
United States
USD/AUD Purchased
0.12
—
17.1M
USD
12.0M
—
—
USD/AUD Sold
-0.12
—
-17.1M
AUD
12.0M
—
—
AUD - Spendable Cash
0.10
—
15.1M
AUD
15.1M
—
United States
USD/AUD Purchased
0.08
—
11.4M
USD
8.0M
—
—
USD/AUD Sold
-0.08
—
-11.4M
AUD
8.0M
—
—
USD/AUD Purchased
0.03
—
4.3M
USD
3.0M
—
—
USD/AUD Sold
-0.03
—
-4.3M
AUD
3.0M
—
—
USD/AUD Purchased
0.02
—
2.8M
USD
2.0M
—
—
Trailing returns · 31 OCT 2026
Displays total returns after fees at net asset value, the return at the ASX market price, the return before fees, and where the fund ranks among funds in its Morningstar category, sourced from Morningstar.
Fund (NAV)Market price
1M
-0.9
3M
1.4
6M
5.6
YTD
11.6
1Y
11.9
3Y
23.1
5Y
11.8
10Y
15.2
Period
Fund (NAV) %
Market price %
Before fees %
Rank in category
1 month
-0.87
-0.11
-0.87
48 / 37
3 months
1.43
2.67
1.44
32 / 37
6 months
5.63
6.95
5.65
55 / 37
Year to date
11.61
12.34
11.65
57 / 34
1 year
11.89
12.47
11.93
59 / 33
3 years p.a.
23.14
23.99
23.19
29 / 23
5 years p.a.
11.80
12.24
11.84
24 / 17
10 years p.a.
15.16
15.23
15.22
19 / 12
Returns to 31 OCT 2026, periods of 3 years and longer annualised. Rank is the percentile in the Morningstar category at 30 SEP 2026 (1 = best) over the funds ranked.
Calendar year returns
Displays the total return after fees and the capital (price) return for each calendar year, with the fund's rank in its Morningstar category, sourced from Morningstar.
TotalCapital
2016
14.4
2017
11.0
2018
6.8
2019
29.5
2020
8.1
2021
36.5
2022
-13.9
2023
29.0
2024
36.7
2025
10.2
Year
Total %
Capital %
Rank in category
2025
10.19
8.08
36 / 30
2024
36.70
35.64
23 / 26
2023
28.98
23.86
30 / 19
2022
-13.86
-13.68
57 / 18
2021
36.50
34.95
13 / 18
2020
8.10
5.88
34 / 13
2019
29.54
28.15
39 / 14
2018
6.78
4.72
24 / 14
2017
10.99
10.76
45 / 14
2016
14.44
10.26
67 / 15
2015
15.75
11.51
1 / 3
Financial year returns
Displays the total return after fees for each financial year to 30 June, sourced from Morningstar.
FY17
14.3
FY18
18.7
FY19
15.7
FY20
9.1
FY21
28.9
FY22
-2.6
FY23
23.2
FY24
23.9
FY25
17.0
FY26
15.2
Financial year
Total %
Financial year to date
0.07
Year to 30 JUN 2026
15.24
Year to 30 JUN 2025
16.97
Year to 30 JUN 2024
23.90
Year to 30 JUN 2023
23.15
Year to 30 JUN 2022
-2.59
Year to 30 JUN 2021
28.91
Year to 30 JUN 2020
9.07
Year to 30 JUN 2019
15.75
Year to 30 JUN 2018
18.68
Year to 30 JUN 2017
14.34
Risk statistics · 31 OCT 2026
Displays how the fund has moved relative to its category index: alpha (return beyond the index), beta (sensitivity to it), R-squared (how much the index explains), volatility and risk-adjusted returns, sourced from Morningstar.
1 year
3 years
5 years
10 years
Alpha
0.62
0.48
0.74
0.46
Beta
0.98
0.97
0.98
0.98
R-squared
99.77
99.77
99.69
99.63
Standard deviation
13.40
12.33
15.50
15.34
Sharpe ratio
0.02
1.23
0.80
1.13
Sortino ratio
-0.02
2.32
1.27
1.95
Tracking error
0.55
0.62
0.72
0.75
Information ratio
1.24
0.23
0.93
0.41
Upside capture %
98.44
98.56
99.92
99.92
Downside capture %
93.32
94.95
95.30
97.49
Maximum drawdown %
-8.45
-9.79
-15.46
-15.46
Measured against MSCI USA NR AUD with RBA Bank accepted Bills 90 Days as the risk-free rate, to 31 OCT 2026. Maximum drawdown is on gross returns at the latest quarter end.
Portfolio risk score
Displays Morningstar's Portfolio Risk Score for the fund's holdings, how closely the ETF tracks its index day to day, the estimated cost of holding it against the index, the cost of trading it at market size, and its best and worst quarters since inception, sourced from Morningstar.
Risk score
93.9
Cash 0
Global shares 100
Morningstar Portfolio Risk Score at 30 SEP 2026.
Tracking volatility
0.591
Est. holding cost %
-0.123
Market impact cost %
0.035
Fees and costs
Displays the fund's ongoing costs as a percentage of assets per year: the PDS management fees and costs, performance fee and transaction costs that make up the total cost ratio (the RG 97 forward estimate, and what was charged last financial year), and the buy / sell spread, sourced from Morningstar.
Management fees and costs
0.04% p.a.
Performance fee costs
0.00% p.a.
Transaction costs
0.01% p.a.
Total cost ratio
0.04% p.a.
Total cost ratio (last FY)
0.04% p.a.
Performance fee
Not Disclosed
PDS dated
5 NOV 2026
Distributions
Displays the most recent distribution paid per unit and its key dates, sourced from Morningstar.
Latest distribution
0.1733
Ex Date
29 SEP 2026
Record Date
30 SEP 2026
Pay Date
9 OCT 2026
NAV at ex date
72.96
Paid this year
0.5458
Distributions by year
Displays the total distributions paid per unit in each calendar year, sourced from Morningstar.
2024
0.7
2023
0.8
2022
0.5
2021
0.5
2020
0.5
2019
0.5
2018
0.7
2017
0.3
2016
0.4
2015
0.4
Year
Per unit ($)
2024
0.7033
2023
0.8070
2022
0.5045
2021
0.5359
2020
0.4563
2019
0.4938
2018
0.6706
2017
0.3200
2016
0.4000
2015
0.3930
Distribution history
Displays the most recent distributions by ex date, sourced from Morningstar.
Ex Date
Per unit ($)
29 SEP 2026
0.1733
1 JUL 2026
0.2330
30 MAR 2026
0.1395
29 DEC 2025
0.2014
3 OCT 2025
0.1678
1 JUL 2025
0.1737
28 MAR 2025
0.1604
27 DEC 2024
0.1891
3 OCT 2024
0.1776
1 JUL 2024
0.1406
28 MAR 2024
0.1398
2 JAN 2024
0.1599
Sustainability rating · 31 AUG 2026
Displays the Morningstar Sustainability Rating (1 to 5 globes, more is better) and the portfolio ESG risk score behind it (lower is less risk), against the average of the fund's global category, sourced from Morningstar and Sustainalytics.
Average
ESG risk score
18.31
NegligibleLowMediumHighSevere
Rank in category
35th percentile
Environmental risk
5.14
Social risk
8.30
Governance risk
4.80
Portfolio covered
98.8%
ESG risk of holdings
Displays the share of the covered portfolio held in companies with negligible, low, medium, high and severe ESG risk, sourced from Morningstar and Sustainalytics.
Negligible
0.79%
Low
70.84%
Medium
24.74%
High
2.98%
Severe
0.65%
9.65% of assets are in companies with high or severe controversies.
Carbon · 30 SEP 2026
Displays the portfolio carbon risk score (lower is less exposure to the transition to a low-carbon economy), the share of the portfolio in companies with fossil fuel revenue, and whether the fund earns Morningstar's Low Carbon Designation, sourced from Morningstar and Sustainalytics.
Carbon risk score
6.76
LowMediumHighSevere
Carbon risk
Low Risk
Rank in category
47th percentile
Fossil fuel involvement
5.66%
Category average
4.42%
Low Carbon Designation
Yes
Portfolio covered
98.7%
Fund managers
Displays the people Morningstar lists as managers of the fund, sourced from Morningstar.
JKJane Kim
CZColin Zhang
Tenure
Displays how long the managers have run the fund: the average and longest tenure, who has served longest, the latest appointment and how many other funds the team manages, sourced from Morningstar.
Number of managers
2
Average tenure
11.6 years
Longest tenure
12.4 years
Longest serving
Colin Zhang · since 16 JUN 2014
Most recent appointment
Jane Kim · since 1 FEB 2016
Managed since
16 JUN 2014
Other funds managed
51
Displays all company announcements released by the company to the exchange, sourced from Morningstar.
The IVV ETF remains one of the simplest and most cost-effective ways to gain exposure to US equities, but we're increasingly questioning whether it's the best way to invest in the US market at this point in the cycle. Today, the 10 largest holdings account for ~40% of IVV, with Nvidia (~8.2%), Apple (~7.4%) and Microsoft (~6%) alone representing more than 21% of the ETF.
The S&P 500 edged 0.2% higher on Wednesday, snapping a three-day losing streak, after the Treasury’s surprise decision to increase long-dated bond buybacks helped pull the 30-year yield ~10bp lower to 5.18%. A surge in Healthcare—led by Moderna after positive melanoma vaccine data—offset continued weakness in semiconductors, with the Nasdaq 100 falling 0.2% for a fourth straight session.
The S&P 500 gained +1.1% last week, although the journey was particularly choppy with news flow thick on the ground. The index tumbled -1.5% on Tuesday after the Fed left rates unchanged but the Fed Chair sounded hawkish, while Brent crude climbed above US$90/bbl. on escalating Middle East tensions, pushing 30-year Treasury yields to their highest levels in almost two decades.
The S&P 500 closed down 1.5% overnight, while the Dow dived more than 1100-points delivering its worst session since “Liberation Day” more than a year ago. It sounds dramatic but the chart below shows the market remains in the same relatively tight trading range of the last 3-months. Strong comments from Fed Chair sent US 30-year bond yields to their highest level since the GFC in 2007:
The S&P 500 ended marginally higher overnight despite a positive open. The session was defined by two competing forces: a geopolitical relief rally in the morning, driven by a pause in US-Iran hostilities that sent Brent crude tumbling over 9% and lifted the likes of airlines and cruise lines, and a sharp intraday reversal in semiconductor stocks that capped broader index gains, e.g. AMD (-5.2%) and Nvidia (-5%).
We’re now around 60% through US earnings season and the S&P 500’s 2Q earnings have been exceptionally strong, with around 85% of companies beating EPS expectations, the highest beat rate in five years, however, despite the strength, the market reaction has been muted, with the median stock underperforming the broader index following its results - simply expectations have often been too high.
US stocks retreated overnight with the S&P 500 closing down 0.2% as the US completed its 9th consecutive day of strikes on Iran. Elsewhere, US equities finished mixed overnight, with the Dow falling 0.6% while the Nasdaq rose less than 0.1% after rallying more than 1% intraday. The Dow underperformed as losses in heavyweight constituents, including Apple (-2.6%) and Tesla (-1.9%), weighed on the index, while financials edged lower after a good run.
The S&P 500 experienced a volatile week, opening strongly as semiconductor stocks rallied on a record US$21bn of inflows into chip ETFs and a 20% surge in SK Hynix's ADRs. However, sentiment reversed sharply mid-week after TSMC delivered another strong result but raised FY capex guidance to US$60–64bn, again fuelling concerns AI infrastructure spending may be nearing a peak and future margins could come under pressure.
The S&P 500 closed up 0.4% this morning, helped by a bounce in semiconductors, softer inflation data, and a strong financial sector following earnings beats by the first banks to report. The US banks kicked off earnings season strongly, with Goldman Sachs jumping +9% after comfortably beating expectations, while JPMorgan Chase and Bank of America both gained around +2% following bumper second-quarter results, dragging up the broader financial sector, with UBS rallying by 3.6%. The only bank to disappoint was Citi, which fell 5% on a mixed update. We would expect Macquarie to have a good day – nicely poised to break out of it’s recent trading range to new highs.
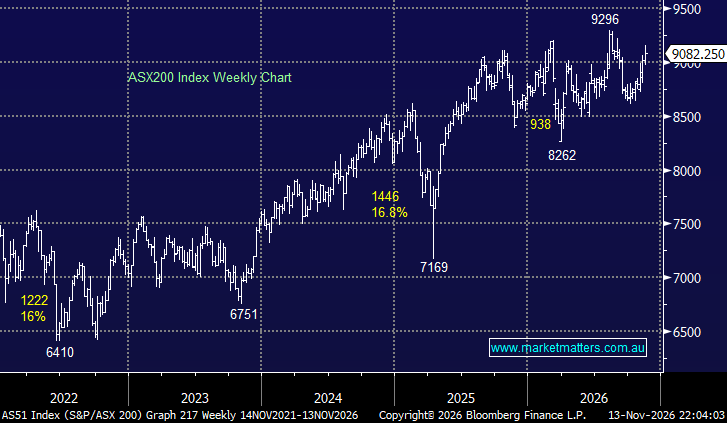
The S&P 500 closed down 0.2% overnight as the Iran situation weighed on risk assets. Still, if you stand back and look at a chart of the S&P500 over the last 3 years, it's simply consolidating before another likely leg higher - there's nothing scary from a technical perspective. However, it feels very different when you read the news! As we know, President Donald Trump declared the Iran ceasefire effectively over at the NATO summit in Turkey, fuelling concerns of renewed Middle East conflict and lifting oil prices. The renewed geopolitical risk has caused investors to understandably recalibrate risk when comments such as “I think it’s over. I don’t want to deal with them anymore. They’re scum”, cross-trading screens.
MM remains bullish towards the S&P 500 around 7600 into Christmas
Business Summary
iShares Core S&P 500 ETF is an exchange-traded fund incorporated in the Australia. The ETF tracks the performance of the S&P 500 Index. The Fund invests in all 500 stocks that comprise the index. The ETF holds predominantly large-cap stocks from U.S. companies.
Check your email for an email from [email protected]
Subject: Your OTP for Account Access
This email will have a code you can use as your One Time Password for instant access
Verication email sent.
Check your email for an email from [email protected]
Subject: Your OTP for Account Access
This email will have a code you can use as your One Time Password for instant access
!
Invalid One Time Password
Please check you entered the correct info, please also note there is a 10minute time limit on the One Time Passcode
To reset your password, enter your email address
A link to create a new password will be sent to the email address you have registered to your account.
Something went wrong. Please try again in a moment.
You're trying to view member-only content
Market Matters members receive daily market reports, real-time trade alerts, full access to 5 portfolios and dynamic company data.
Choose how you'd like to proceed:
We have a range of membership options to suit your needs and budget, why not join today and get unlimited access to the premium Market Matters service.