Thursday saw the ASX200 recover over 60% of the previous sessions losses with the banks, real estate and tech stocks leading the broad advance, 80% of the index rallied with only the resources weighing on the gains. Volatility is clearly rising and I thought today would be an ideal opportunity to delve deeper into the swings over the last decade through the infamous May & June period, we know the combined average decline for the period is 4.8% but I wondered what can be learnt through boring deeper into the numbers. Personally I like to do the maths the old fashioned way with a pen & paper because it often throws up characteristics that a computer fails to pick up:
- The average decline by the ASX200 from its swing high to low during May & June over the last 10-years is 6.8% i.e. 2% deeper than the average closing decline suggesting a recovery at the back end of June is a “good bet”.
- However 30% of the time the pullback was a mere 3% but once it accelerated vaguely further the average became 8.4%.
- The swing high was posted everywhere from the start to May until early June but the low was usually posted mid – June although a standard deviation of 10-days offers little help in identifying exactly when to press the “buy button”.
When analysing statistics it’s very important not to force any particular view onto the numbers and they in fact often provide little solace to the open-minded investor.
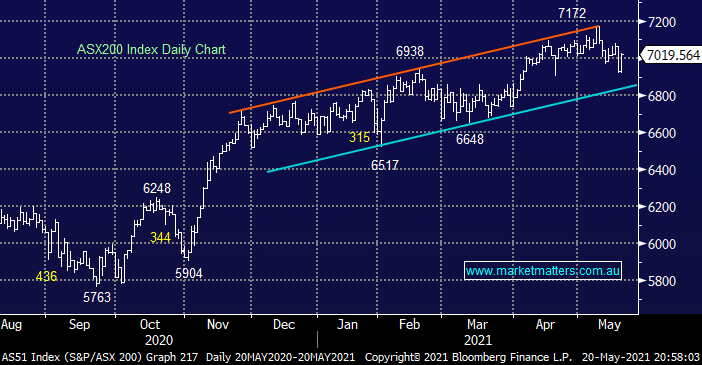
My takeout from the above taking into account the pullback over the last 2-weeks is currently 3.5%, is pretty simple – if the ASX200 breaks the recent 6917 low there’s a strong likelihood the market will test under 6700 otherwise I’m afraid it’s a coin toss.
We currently have a square off between a post COVID booming economy illustrated by numerous strong economic prints of late like the unemployment data yesterday and fears around rising inflation & interest rates, at this stage we believe there’s no need to second guess who will win the arm wrestle simply let the market show the way. At this stage, there are a lot more reasons to be positive the market overall and we are prepared to aggressively buy stocks into weakness, but as we showed above, we might have already seen the extent of the pullback. i.e. 30% of the time over the last decade the seasonal pullback was just 3%. For my clients, we had quite a few that had added new money into portfolios in recent months and yesterday we trickled some of that in given the above interpretation.
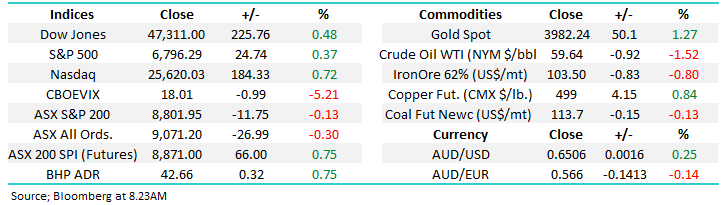
Overnight US stocks followed through on Wednesday nights late recovery with the S&P500 advancing +1.1%, the tech stocks led the gains rallying almost 2%. Today looks set to be a continuation of yesterday with the SPI futures calling the ASX up ~0.4% but BHP and the resources look set to continue their struggle.
MM believes the ASX200 has commenced a traditional May / June pullback
Add To Hit List