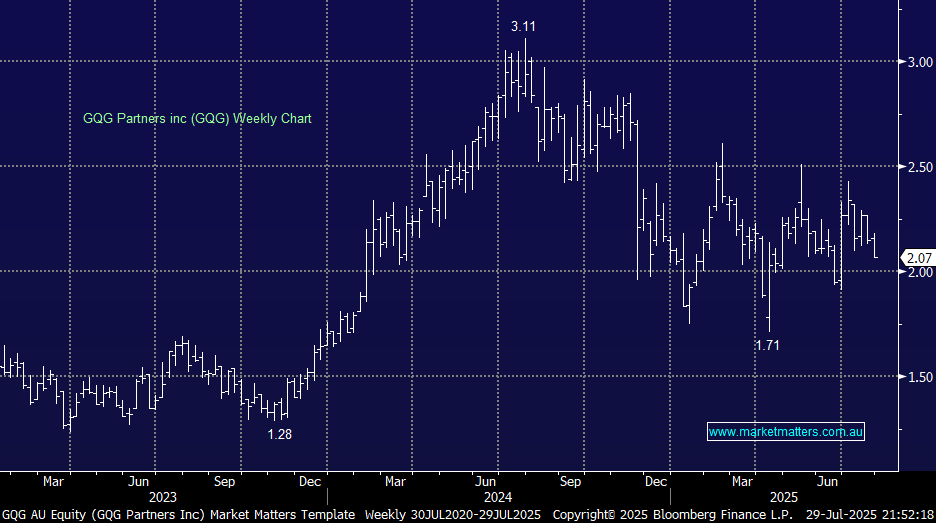
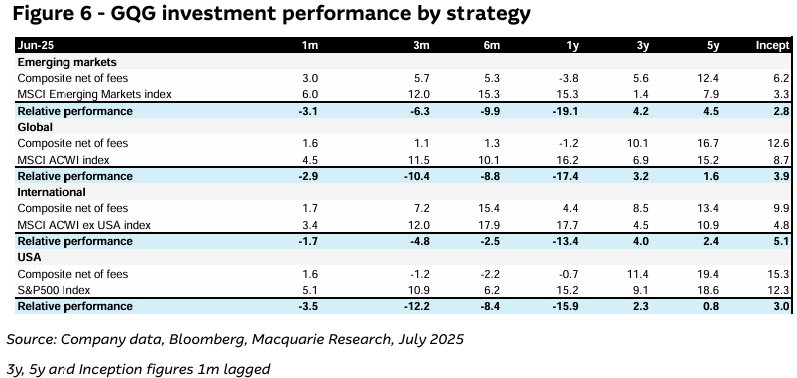
At the end of June, GQG Partners – a global funds management powerhouse – was managing US $172 billion, an increase of US $8 billion over six months. That equates to US $43.7 million per day, including weekends – an extraordinary growth rate that highlights the strength of their distribution capability. What makes this even more remarkable is that it has occurred during a period of relative performance headwinds. Over the six months to June 2025, their Global Equity Strategy delivered a +1.3% return versus the benchmark’s +10.05%, an underperformance of 8.75%. Traditionally, flows follow performance, but in GQG’s case, inflows have remained strong despite a cautious, defensive portfolio stance.
We’ve consistently said investors should back managers with proven long-term track records after a period of weak performance rather than chase funds following a strong run. This is clearly playing out with GQG. Over the longer term, they have demonstrated their ability to generate alpha, with their Global Strategy returning +10.1% (3-year) and +16.7% (5-year) annualised, placing them in the top quartile relative to peers.

Quarterly 13F filings show a clear defensive tilt in GQG’s U.S. equity holdings, with Philip Morris International (PM US) their top holding at ~12%, underpinning a 14.7% allocation to Tobacco. Insurance (12.9%) and Telecommunications (8.7%) round out the top three sectors. This positioning has come at the expense of technology, where key reductions were made in Nvidia (NVDA US) and Meta Platforms (META US), though Microsoft (MSFT US) remains a top 10 position (as it does for MM).
One valuation lens we often use when comparing fund managers is market cap versus FUM. On this measure, GQG’s US $4.2 billion market cap is just 2.4% of FUM. For context, Magellan (MFG) trades at 4.5% (US $1.1 billion market cap vs US $25.4 billion FUM), while Regal Partners (RPL) sits at 5.6% (US $650 million market cap vs US $11.5 billion FUM). Historically, fund managers have traded at 5–10% of FUM, depending on profitability, although valuations for active managers have compressed in periods of weak performance. On this metric, GQG screens well compared to the other two managers we currently own (MFG in the Income Portfolio and RPL in the Emerging Companies Portfolio).
This discount is also apparent in earnings multiples and yield: GQG trades on just 8.5× 1-year forward earnings with an expected 10.7% yield, compared to 14.3× / 5.7% for MFG and 13.5× / 7.3% for RPL. While GQG’s inflows have been impressive, they are slowing, and relative underperformance over the past year has investors questioning whether momentum will reverse, leading to potential outflows if returns don’t pick up.
We own MFG in the Income Portfolio for its valuation, yield and improving performance trajectory – and that investment has now delivered ~33% gains in 5 months as optimism has returned to the stock. The key question now is whether MFG continues to outperform or GQG begins to turn higher from today’s starting point, offering a compelling ~10% yield while we wait.
- We are adding GQG to the MM Hitlist for the Income Portfolio, with MFG as the natural funding source.
MM has turned cautiously bullish on GQG.
Add To Hit List