Subscribers questions (FUEL, VMT, AWC, ATVI US, ALQ, WPL, IFL, IFT NZ, BKW, APT, JHG, OVH, KGN, SPL, HAW)
There’s no obvious good news out there for markets but as we witnessed last week global stocks are looking strong in the face of ongoing adversity, I reiterate if stocks can keep shrugging this news like an annoying mosquito being short / underweight stocks is likely to prove costly. The 2 main themes which caught my attention over the weekend are far from new, but they are important:
1 - Over recent weeks the markets were suggesting that a win for Biden and the Democrats in next month’s US election would lead to a plunge in stocks yet today the bookies are now saying the only question is how badly will Trump lose, not if, yet stocks are recovering strongly from Septembers sell-off.
2 – COVID is getting worse not better across the world, parts of the UK now look like going into lockdown for 6-months, this makes Victoria almost sound like a picnic. Stocks are optimistic of a vaccine in 2021, I feel we should remain very watchful of a potential lose in confidence with the scientific fraternity.
As discussed in the Weekend Report MM believes stocks look strong into Christmas but we won’t be forgetting our favourite mantra of the last 6-months – “buy weakness and sell strength”.
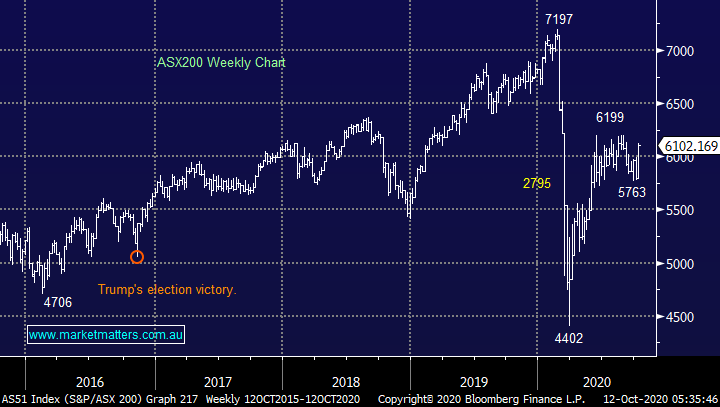
MM remains bullish Australian stocks.
ASX200 Index Chart
Financial markets are now anticipating the RBA will cut interest rates to 0.1% on Melbourne Cup Day, in absolute terms that’s a massive 60% fall. With the interbank overnight lending rate at 0.13% and 3-year bonds now falling to match the anticipated cut stocks remain an attractive asset class, term deposits are already yielding under 1%, an extremely challenging tough environment for the yield hungry investors / retiree with equities still looking the standout option.
MM believes rates will remain low throughout 2021.
Australian 3-year Bond Yield Chart
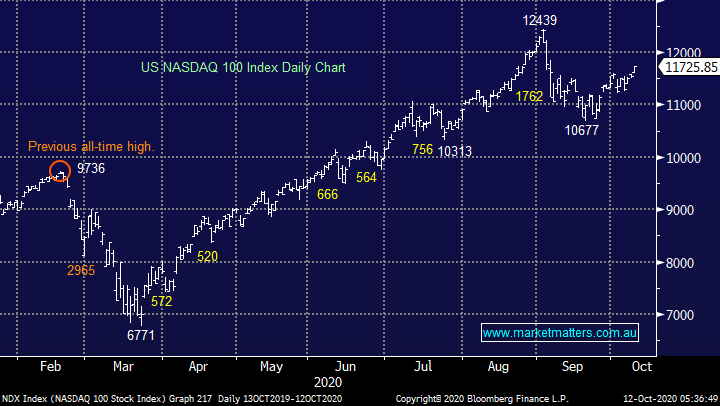
The tail that continues to wag the proverbial dog in equities land is tech which following last week’s recovery is less than 6% from its all-time high, we can see this being scaled in the not too distant future.
MM remains bullish US Tech.
US NASDAQ Index Chart
Thanks again for the questions, you’re input underpins Monday’s report.
Question 1
“Hi all, which oil ETF, would you recommend as the best for us to invest on the ASX?” - Thanks Daniel C.
Morning Daniel,
We hold FUEL from Betashares in our ETF portfolio, this tracks a bunch of global energy companies rather than crude oil itself. They also have a crude oil ETF under code OOO, however that trades in crude oil futures so there is the complexity around rolling from month to month. We saw the front month contract trade negative a few months ago due to concern around storage.
MM prefers getting crude oil exposure via the producers, with FUEL our preferred option.
BetaShares FUEL ETF (FUEL) Chart
Question 2
“Hi James, Thanks for your great work in helping us forgotten self fundies, 2 million of us don't exist according to Joshy and Mattais the Terminator. I am trying to diversify away from dividend traps, can you shed any light on the following: VMO, TNT, NAN, EMV, STK, BOE.” - cheers Tim.
Morning Tim,
Sorry for the brevity but that’s a lot of questions on a Monday morning:
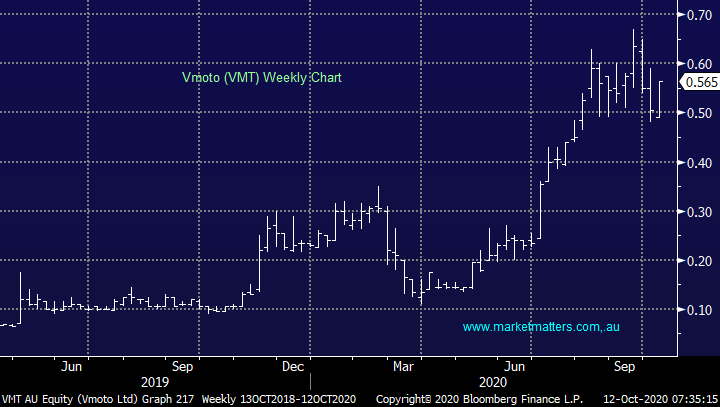
Vmoto (VMO) - we like this $150m scooter business targeting ~20% upside.
Tesserent (TNT) – we are neutral to bullish this internet security business.
Nanosonics (NAN) – neutral.
Emvision (EMV) – neutral / bullish this healthcare testing business.
Strickland Metals – neutral this $38m mineral exploration business after its strong rally.
Boss Resources (BOE) – neutral at best this mineral exploration business.
Vmoto (VMT) Chart
Question 3
“Can you please comment on AWC. Looking sick” – Sanjay S.
Morning Sanjay,
Alumina (AWC) has certainly been underperforming since July but we remain bullish both the market and resources after last week’s flip higher, we touched on this in the Weekend Report hence MM is comfortable holding AWC albeit as a disappointed investor at this point in time.
MM remains bullish Alumina (AWC).
Alumina (AWC) Chart
Question 4
“If MM have looked at ATVI could you let me know the date.” - Thanks Chris G.
Morning Chris,
eSports is an area that I’m only just becoming familiar with in terms of investment. I think this space offers incredible growth opportunities and I’m slowly getting my head around the ways it’s monetised, and what the future could look like.
Activision (ATVI US) is a player here but at this stage I will only give you a quick technical perspective.
MM likes ATVI below $US75 with stops under $US62.
Activision (ATVI US) Chart
Question 5
“Hi James & MM Team. I am a new subscriber and moved over to you for better advice and now need a bit of housekeeping on my portfolio. I am suffering a current 40% loss on LVT, YOJ and AU8. Do I cut my losses out of them and then buy Z1P, XRO and/or ALQ for a better potential investment and potential capital recovery. Your views would be appreciated.” - Cheers Geoff S.
Morning Geoff,
Welcome aboard! History tells us that cutting ones losses and moving on is generally the best course of action hence the often trotted out phrase – “run your profits and cut your losses” however at MM we cannot give personal advice hence I will simply take a brief look on the stocks mentioned.
LVT, YOJ and AU8 all look ok from a risk / reward perspective. Obviously these are relatively small cap stocks who often exhibit significant volatility but technically they look ok.
MM is long Z1P and XRO and while we like both stocks the risk / reward has diminished after strong rallies in recent weeks, we are only looking for ~10% more upside from tech before a period of consolidation hence we are happy holders but chasing here needs careful consideration as to the timeframe of such investments – even top quality businesses see their shares pull back at times.
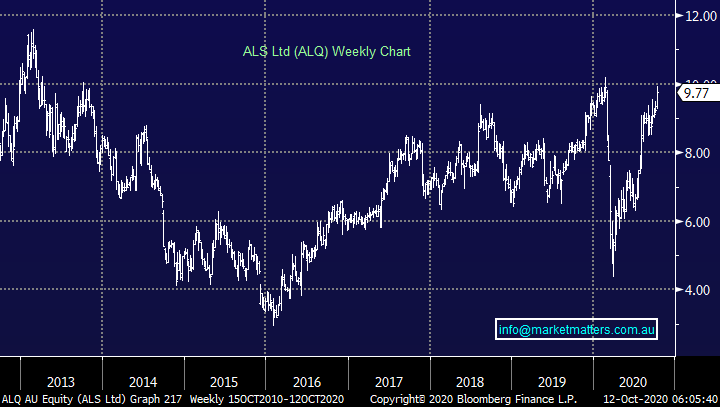
ALS Ltd (ALQ) is a company we like but don’t own. If I was buying today, I would leave some ammunition to average any pullbacks under $9.
We remain bullish Z1P & XRO
ALS Ltd (ALQ) Chart
Question 6
“Hi James, Could you advise what is going on with WPL and IFL. Both of these stocks have sold off heavily after the close in recent sessions. It can't be just Short covering or Options expiring can it? You indicated IFL is on your radar. With new management and the buyout of NAB & MLC Wealth portfolios, this is looking cheap @ 11x PE and Div @ 6%. What are the risks of buying now and dividend reduction? Is it a Yield trap as Guidance is absent? Also WPL is looking well priced & maybe STO & ORG. What is your outlook for the Brent Oil & Gas spot prices over the medium term? Each of these stocks fit SCOMO's big East Coast Gas Hub Push strategy for a new LNG Power Plant in NSW, replacing Coal to reduce the cost of electricity for Industry and households. Do the metrics/risk stack up for these stocks now? I find your stock appraisals and reviews well researched and of help in this volatile market.” - Keep up the good work Richard O.
Morning Richard,
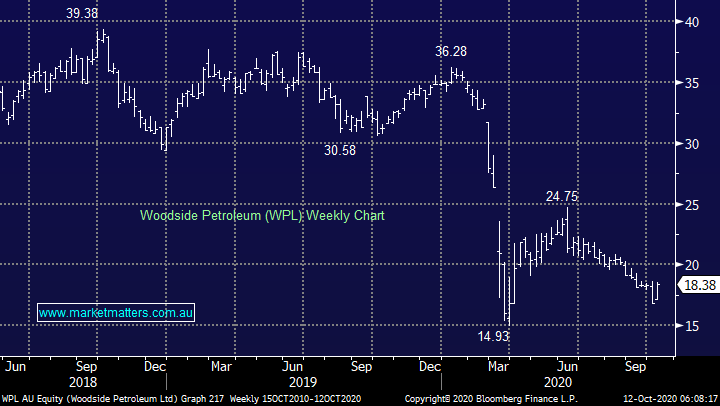
I will answer separately for obvious reasons, WPL is suffering in our opinion from the global trend away from fossil fuels by major fund managers. Crude oil and natural gas prices remain firm yet the likes of WPL has corrected over 30% as the volume of buyers diminishes, again economics comes down to simple supply and demand and this is one sector I believe we should expect to trade at lower valuations P/E’s moving forward. However, the elastic band effect we feel has gone too far and MM believes WPL and the Energy Sector represents solid value today.
MM likes WPL around $18.
Woodside Petroleum (WPL) Chart
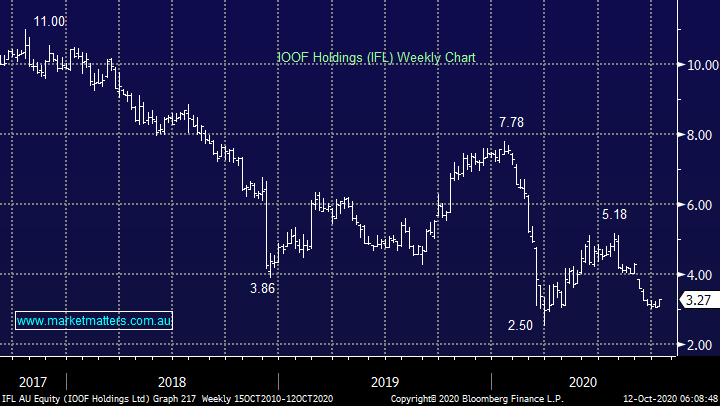
Much has been written about IFL now its time for the management to show us they can “bed down” their buyout of NAB & MLC Wealth. Its undoubtedly a tough environment to take on this major undertaking but we believe accumulating IFL into weakness (as we have done in our income portfolio) makes sense. Currently, the consensus dividend yield is 7.87% and we would expect this yield to be sustainable unless a left field event occurs that will crimp earnings.
We covered in more detail in recent income notes – click here
MM likes IFL into weakness.
IOOF Holdings (IFL) Chart
Question 7
“Hello people Was doing some research on IFL ....following your suggestion for income Does look interesting!!!! When researching saw IFT (Infratil NZ ) it also looked interesting in terms of growth and yield ( but no franking credits ) . Do you have any views on IFT?” - Thanks and cheers Shane B.
Hi Shane,
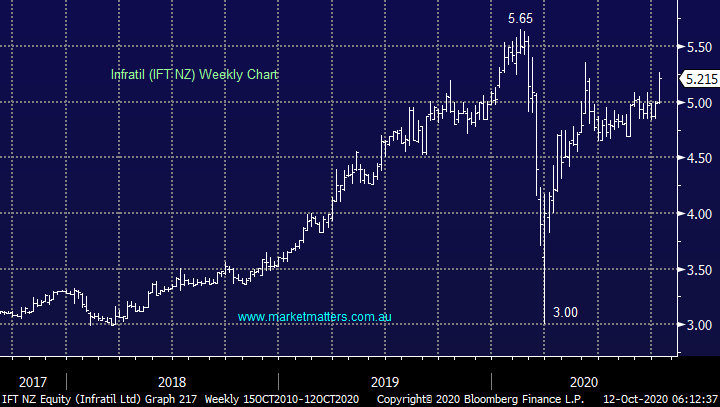
I actually haven’t looked at IFT before, they invest in infrastructure ranging from airports to renewables. While I’d want to dig deeper before having more conviction, technically IFT looks on track for fresh highs, around 15% upside plus as you mentioned its forecast 3.26% dividend over the next 12-months is attractive in today’s zero rate world.
MM bullish Infratil.
Infratil Ltd (IFT NZ) Chart
Question 8
“Hi MM, love the newsletter. Essential reading. I bought into Brickworks close to its 2020 low and now it’s making me nervous. What do you think of Brickworks and how much further has it got to run?” - Cheers, Jill C.
Hi Jill,
Interesting psychological point here Jill, your nervous because your making good money! Unfortunately, most people are wired to be poor investors i.e. grab quick profits and hold / hope with the losers, the complete opposite to the classic winning formula.
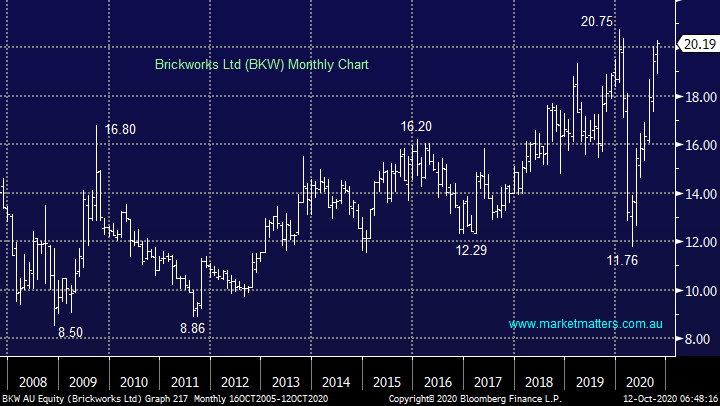
Firstly, well done to have both bought held BKW, the stocks almost doubled which is great, at MM we remain bullish both the building Sector helped by stimulus and the underlying market. However we often say people should trade / invest to sleep hence it’s not uncommon that we take a part profit if one of our holdings shoots higher for example, also we trim positions at times when they feel a bit off - you need to evaluate your holding within your portfolio and make a risk / reward decision – again congratulations!
MM is bullish BKW moving into 2021.
Brickworks Ltd (BKW) Chart
Question 9
“Hi James, I really like your concise to the point report. You have noted the heavy weight healthcare stocks today but what's your opinion on the small sector healthcare stocks like IPD, OSL, AVH, NXS to name a few.” - Many Thanks
Peter C.
Morning Peter,
I think the easiest way to answer this is by going back to one of our points in the Weekend Report where we illustrated that the US Russell 2000 small cap index had outperformed its “big brothers” in recent weeks, I see no reason not to believe the same wont unfold under the hood of the Healthcare Sector.
MM is bullish small caps at least short-term.
Russell 20000 Index Chart
Question 10
“Hi MM team, I was thinking (always a “hit ’n miss” moment) but nevertheless ….If one considers Banks vs BNPL or growth vs value or tech companies vs non-tech - what distinguishes a change in momentum from a structural change? For me, momentum can be either short or long term whereas structural is long term. I would be interested in your thoughts. To provide a bit more body to my question, for some time now we have seen how many “average” companies only maintain their position because of the generous tailwinds from influences such as the stimulus provided by central banks and governments, the retirees quest for “yield”, the US/China fear that drove LYC to recent highs, CV-19s impact on our social behaviour, etc, etc.” - Thanks, Jan P.
PS. I think that by MM publishing the Jono Higgins interview on Livewire created a bit of momentum in the BNPL space on Thursday's market
Hi Jan,
A great question which you have part answered yourself, momentum is indeed a function of timeframe e.g. at the moment we expect Afterpay to make fresh all-time highs short-term before a period of consolidation = bullish short-term and neutral medium. However long term it remains bullish – hopefully not too confusing!
However structural change is where the real money is made, as opposed to momentum which adds some alpha around the edges. Investors should look to have portfolios positioned in the direction of perceived structural change in the most part hence the advantages of investing with an international flavour, it simply provides more opportunities to gain exposure to the future trends i.e. looking through the windscreen not in the rear view mirror.
MM is bullish short-term.
Afterpay Ltd (APT) Chart
Question 11
“A couple of questions for Mondays report. What are your current thoughts on JHG which has rallied hard over recent weeks. From memory you had concerns with it given its continuing cash outflows. Also, OVH was recently subject to an increased takeover offer (40 cents increased to 43 cents) but the share price has fallen by around 10/15%. Is that the market saying they don't think the takeover will proceed?” – Ian C.
Morning Ian,
Takeovers are clearly on your radar this morning. The news that New York based Trian Partners has bought 9.9% of both Janus Henderson (JHG) and Invesco Ltd (IVS US) has prompted strong talk that a merger may be in offing. Fundamentally it makes sense and both companies are cheap if they can maintain current assets under management. Its taken a while for someone to see value in JHG but where to now for the share price, a lot of merger upside is now factored in – we will look at the rest of the sector this week.
MM now likes JHG with stops under $31.
Janus Henderson (JHG) Chart
Onevue Holdings (OVH) does have a bid on the table at 43c, however, as I understand it, Thorney now owns just shy of 20% of the company and will not support the deal, hence the drop in SP. 2 things could happen here. They could force a higher bid of they could dig in their heals and block it, looking for better long-term value.
OVH have has issues on a few fronts in recent times, however with a bid on the table at 43c, this looks like a good bet at 34.5c.
MM is bullish OVH.
Onevue Holdings (OVH) Chart
Question 12
“Hi James, It looks as if on-line shopping is not only here to stay, but it will only accelerate in the future. Could you please nominate your top 3 picks in this space, in terms of capital growth potential over the medium-term ? There are a lot to choose from e.g. AX!, KGN, NCK, TPW, RBL, ADH, CCX etc.” - best wishes John K.
Morning John,
Another huge question which deserves its own report, a quick answer:
1 – Kogan (KGN) but leave ammunition to accumulate down to $18.
2 – Amazon (AMZN US) again leave ammunition to accumulate under $US3000.
3 -Wait for a new kid on the block to start kicking goals like Temple and Webster (TPW) a few years ago – holding some cash in this evolving market never hurts.
Note that’s a deliberate mix of 2 quality established businesses and some cash to pick the next “big thing”.
NB: Nick Scali (NCK) is not big in online.
Kogan.com Ltd (KGN) Chart
Question 13
“I would like to have your thoughts about the special purchase plan for Starpharma for up to $30,000 at $1.50. Firstly the price of the offer is about the same as current market price. Would it be better to buy in the market than participate in the SPP?” - Thanks Kenneth C.
Morning Kenneth,
In today’s market when a stock fails to hold above its SPP I’m inclined to steer away, there are platy of other fish in the sea. However if you want to increase your exposure to Starpharma the SPP is still marginally cheaper.
Starpharma Holdings (SPL) Chart
Question 14
“James, do you have any comments or intelligence on Hawthorn Resources (HAW)? The share price has had significant increase since March and has continued to hold around current levels for some time.” - Cheers Colin H.
Morning Colin,
I’m sorry $50m resources business HAW is not one I’m particularly familiar with, I would just be “playing” technically i.e. long with stops under 12c.
Hawthorn Resources (HAW) Chart
Have a great day & week!
James & the Market Matters Team
Disclosure
Market Matters may hold stocks mentioned in this report. Subscribers can view a full list of holdings on the website by clicking here. Positions are updated each Friday, or after the session when positions are traded.
Disclaimer
All figures contained from sources believed to be accurate. All prices stated are based on the last close price at the time of writing unless otherwise noted. Market Matters does not make any representation of warranty as to the accuracy of the figures or prices and disclaims any liability resulting from any inaccuracy.
Reports and other documents published on this website and email (‘Reports’) are authored by Market Matters and the reports represent the views of Market Matters. The Market Matters Report is based on technical analysis of companies, commodities and the market in general. Technical analysis focuses on interpreting charts and other data to determine what the market sentiment about a particular financial product is, or will be. Unlike fundamental analysis, it does not involve a detailed review of the company’s financial position.
The Reports contain general, as opposed to personal, advice. That means they are prepared for multiple distributions without consideration of your investment objectives, financial situation and needs (‘Personal Circumstances’). Accordingly, any advice given is not a recommendation that a particular course of action is suitable for you and the advice is therefore not to be acted on as investment advice. You must assess whether or not any advice is appropriate for your Personal Circumstances before making any investment decisions. You can either make this assessment yourself, or if you require a personal recommendation, you can seek the assistance of a financial advisor. Market Matters or its author(s) accepts no responsibility for any losses or damages resulting from decisions made from or because of information within this publication. Investing and trading in financial products are always risky, so you should do your own research before buying or selling a financial product.
The Reports are published by Market Matters in good faith based on the facts known to it at the time of their preparation and do not purport to contain all relevant information with respect to the financial products to which they relate. Although the Reports are based on information obtained from sources believed to be reliable, Market Matters does not make any representation or warranty that they are accurate, complete or up to date and Market Matters accepts no obligation to correct or update the information or opinions in the Reports. Market Matters may publish content sourced from external content providers.
If you rely on a Report, you do so at your own risk. Past performance is not an indication of future performance. Any projections are estimates only and may not be realised in the future. Except to the extent that liability under any law cannot be excluded, Market Matters disclaims liability for all loss or damage arising as a result of any opinion, advice, recommendation, representation or information expressly or impliedly published in or in relation to this report notwithstanding any error or omission including negligence.

