Is this the time for Fund Managers to outperform? (BIN, CWY, AMZN US, JHG, NWL, MFG, PPT, PTM, IFL, CGF)
Yet another strong session for Australian stocks to start off the week, the ASX200 has now advanced over 300-points / 5% in October and with the banks joining the “bull party” an assault above 6200 feels imminent. Only just over half of the market closed positive on Monday but it was the correct sectors from both a sentiment and points perspective i.e. IT stocks led the charge rallying 3% followed by the important heavyweight financials which advanced +1.2%.
The market enjoyed some M&A activity yesterday which makes sense considering interest rates are at record lows, there’s never been a better time to borrow money and expand through acquisition, assuming of course you’re happy with both your own company under the hood and the respective industry as a whole. Link Administration (LNK) rocketed up 25% on the news of a takeover bid at $5.20 from Pacific Equity Partners & The Carlyle Group, encouragingly the company’s largest shareholder Perpetual (PPT) appears keen on the deal. Also Bravura (BVS) which we own in our Growth Portfolio rallied almost 9% after agreeing to buy UK Pensions admin technology company for just over $40m, we like the deal for BVS which is set to be earnings accretive in FY21 and funded with cash.
Elsewhere the BNPL space remained “hot” with Afterpay (APT) gaining +2.8% and Zip (Z1P) which we also own in our Growth Portfolio +5.7% - MM remains long and bullish tech stocks but remember our target for APT is now only ~8% away and we feel this remains a market to “buy weakness and sell strength”. Tech stocks continue to outperform as anticipated but the wider the gap becomes the closer, we become to considering a switch back to overweight the Resources Sector but there’s no hurry at present.
MM remains bullish stocks into 2021.
ASX200 Index Chart
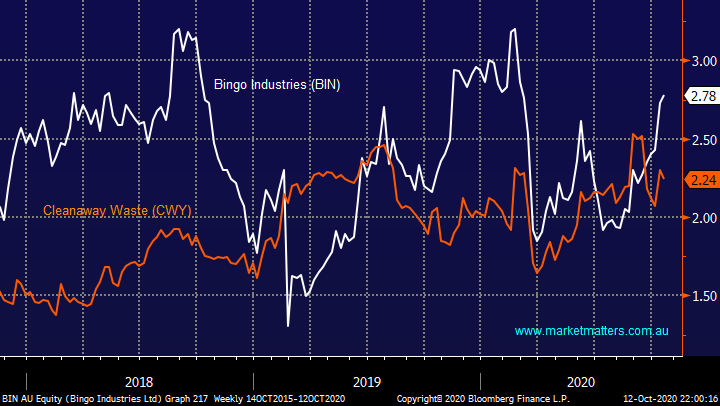
Yesterday after the market closed we received the news that Bingo’s (BIN) Ian Malouf had sold over 2 million shares, or around 2.6% of his holding – never good news but not a huge divestment and understandable as the stock has rallied by 50% since July. Over the last month BIN has rallied +22% while obvious sector alternative Cleanaway (CWY) has fallen -11% and if we go out 3-months the performance differential goes past 40% begging the question has the relative valuation elastic band stretched too far and a switch from BIN to CWY is worth considering.
1 – Commentary yesterday from Bingo (BIN) which was in line with recent updates and in today’s market no surprises is good news hence the stocks ~2% gain.
2 – CWY has been struggling since the company confirmed reports of bad workplace behaviour by its CEO, only a warning for the bullying feels lenient in today’s environment, we feel happy to be an observer this stage.
MM still prefers BIN over CWY – but we are monitoring the differential carefully.
Bingo Industries v Cleanaway waste (CWY) Chart
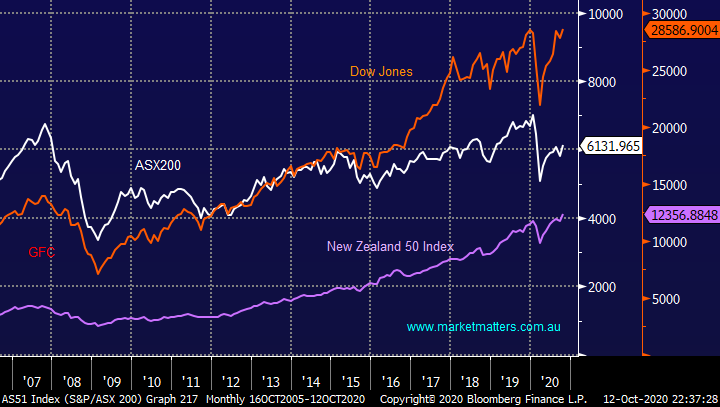
I know it’s not Monday, but I thought I would slip this early question into today’s report as it touches on part of the stock / sector relative performance that’s so prevalent in 2020’s market. I also overlooked it on Monday – apologies Geoff.
“James, comparison of the Dow, NZSX and the ASX over recent years is really interesting. In years past, the NZ index was at 2,000 while at the same time the ASX was around 4,000. Since then the NZ has increased nearly 6 fold to close to 12,000, while the ASX struggles to get past 6,000 (with one outbreak to 6,800). In recent years the Dow has doubled. Interestingly, the Dow is holding up despite the President's health issues and Biden's increasing poll percentage numbers. I was thinking that a possibility of Biden winning would affect the Dow negatively. So, the question is really why is it that the ASX can't show the same strength that the Dow and the NZ can? especially the NZ index, it is such a small market.” - Geoff.
I believe the answer as to why Australia has dragged the chain post the GFC lies primarily beneath the hood:
1 – Across the ditch in New Zealand things have looked amazing but as you say it’s a small market, its entire market cap is less than that of CSL. The combined market weight of a2 Milk (A2M) and Fisher & Paykel (FPH) is now over 30% of the NZ market, up more than tenfold in 17-years, hence the indices great performance is basically a read through of these 2 major success stories.
2 – The US indices has obviously been dominated by big tech and although the Dow isn’t dominated by these names the Dow today does contain Apple (AAPL US), Microsoft (MSFT US) and Cisco Systems (CSCO US). Also, for good measure it has a much lower banking exposure, when combined with tech this has led to a strong index.
3 – Lastly there are some sectors of the ASX which have compared well to the above 2 high flyers, such as IT and Healthcare, but when the ASX200 is comprised of over 20% banks and these companies have to operate in an almost zero interest rate environment combined with arguably the most regulated backdrop on the planet it’s not surprising things have been tough locally – as we often say “we can’t go up or down without the banks”.
ASX200, NZ 50 Index & Dow Jones Chart
Overseas indices & markets
Overnight US stocks continued their recovery led again by the Tech Sector which rallied over 3% with Apple (AAPL USD) and Amazon (AMZN US) both gaining around 5% - we’ve been flagging an imminent squeeze in the sector after it was carrying a record short position around 10 days ago, this appears to be playing out on cue. Our initial upside target remains around 5% higher, we will be considering taking a little profit within our International Portfolio if this unfolds as expected.
MM continues to believe US stocks have found a significant short-term low.
US NASDAQ Index Chart
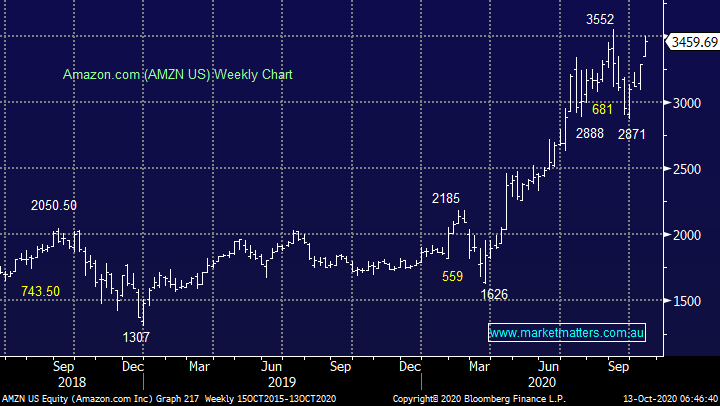
Overnight Amazon (AMZN US) rallied +4.8% approaching fresh all-time highs in the process, we remain bullish, but our upside target is approaching fast.
MM remains bullish AMZN with our initial target now only ~5% higher.
Amazon.com (AMZN US) Chart
Is it time to buy Fund Managers?
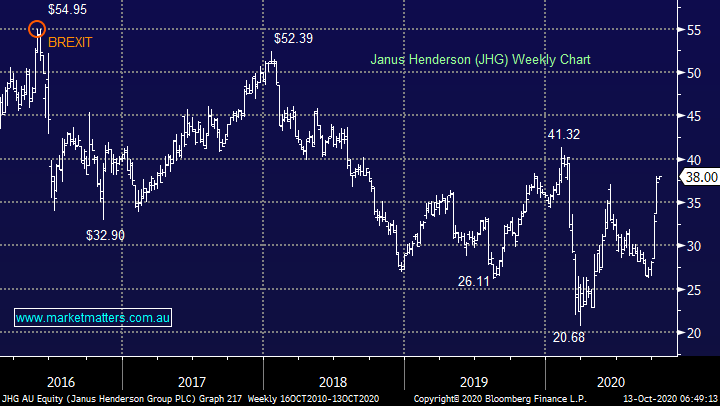
The past fortnight has seen UK based investment manager Janus Henderson surge over 35% on the news that New York based Trian Partners has bought 9.9% of both Janus Henderson (JHG) and Invesco Ltd (IVS US), a move which has prompted strong talk that a merger may be in the offing. Fundamentally it makes sense and both companies are cheap, and scale is important in asset management. The sector has been in the naughty corner longer than I would have imagined considering the recovery in equities since March, especially from a global perspective however it is the underperformance of the ASX touched on earlier which would have caused these financials to remain cheap e.g. over the last year global focused local manager Magellan (MFG) is up 30% compared to Perpetual (PPT) which is down -14%.
Janus Henderson (JHG) Chart
Today we have briefly looked at 5 financial stocks to see if they offer good risk / reward moving forward if the sector becomes rerated as opposed to hoping for another takeover. Importantly its about looking forward if the ASX does start to match its global peers on performance, APRA being handed the banner to monitor responsible lending might just be the first glimmer of hope that the “red tape” which frustrates both small and large business alike in Australia is finally being repelled, we need all the help we can get post COVID!
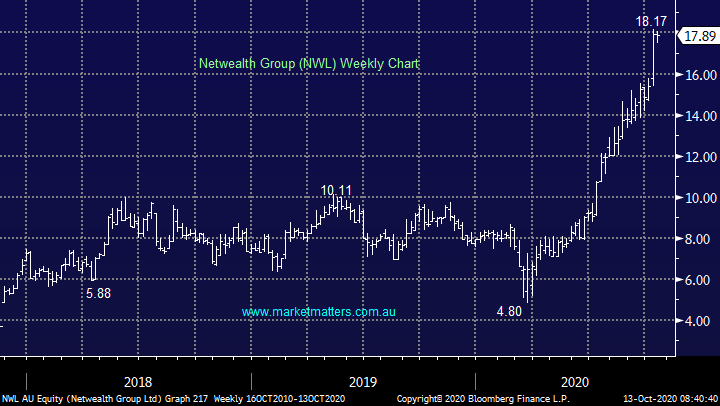
There another 2 parts of the equation in our opinion , firstly the massive transition towards ETF’s / index hugging investment vehicles meaning that more than ever only the strong / top performers will thrive hence the outflows that JHG has been experiencing of late. Secondly if we believe that the ASX is going to finally start standing on its own 2-feet why not simply select stocks ourselves as opposed to entrusting it to these large fund managers that often lack the flexibility due to their sheer size. The recent success of Netwealth Group (NWL) which is a fintech innovator with the financial services space illustrates perfectly that the best returns haven’t been generated by the old fashioned “masters of the universe”. Our initial conclusion isn’t too exciting:
MM is only now interested in stock specific parts of this sector which need to be “cheap” and offer good risk / reward.
Netwealth Group (NWL) Chart
The 5 major members of the sector we’ve considered are with a view to tweaking our exposure towards domestic facing fund managers.
1 Magellan Financial Group (MFG) $63.30
Firstly, as a point of comparison I have considered MFG which resides in our Growth Portfolio and is acting as a quasi US tech position due to its core holdings. Our view hasn’t wavered, we are still looking for US tech to make fresh all-time highs which should help MFG test the $70 area.
MM remains bullish MFG looking for ~10% upside.
Magellan Financial Group (MFG) Chart
2 Perpetual (PPT) $30.20
PPT has suffered an almost 30% drop in net profit for FY20 due to outflows and COVID inspired market volatility, nothing new here – the stock is still yielding ~5% but some capital gain would be nice. Being bullish equities it’s no surprise MM can see upside in PPT with a technical target close to $40 but for that to unfold a lot needs to fall into place, after recently exiting from our Income Portfolio in favour of beaten up IOOF (IFL) we have the stock in the “watch” basket.
MM likes PPT with stops under $26.50 – over 12% risk.
Perpetual (PPT) Chart
3 Platinum Asset Mgt (PTM) $3.26
PTM is described as an international value investor and as such they’ve largely missed the rally in tech & growth stocks hence outflows have been ongoing, more than $200m was pulled in September alone. MM might reassess PTM when we believe its time to switch from the likes of tech to resources but at this stage we see no reason to chase PTM, particularly while the ongoing overhang from founder Kerr Neilson’s large holding remains.
MM is neutral PTM.
Platinum Asset Mgt (PTM) Chart
4 IOOF Holdings (IFL) $3.29
We recently purchased IFL for our Income Portfolio, this is a very unloved wealth / funds management company which has recently bought MLC and raised ~$1bn in fresh equity. We believe that recent selling pressure is drying up and the stock has now hit an attractive accumulation level.
MM feels IFL is an accumulation zone.
IOOF Holdings (IFL) Chart
5 Challenger (CGF) $4.23
CGF is a slightly different story being Australia’s largest annuity business, but its performance is very comparable as they need to generate returns from their investments to underpin annuity obligations, plus they do have funds management businesses. Here lieth the issue, fixed interest rates have tumbled to almost zero and stocks have become volatile. At this stage we’re neutral but after being smashed value is emerging in CGF, plus it might even be on somebodies menu.
MM is neutral CGF at present.
Challenger (CGF) Chart
Conclusion
At this stage MM are not interested in buying any of the 5 covered, we like the idea of accumulating IOOF into further weakness (as we did with our Income Portfolio) while the possibility of a switch exists if MGF pops towards $70 and the others continue to tread water.
Have a great day!
James & the Market Matters Team
Disclosure
Market Matters may hold stocks mentioned in this report. Subscribers can view a full list of holdings on the website by clicking here. Positions are updated each Friday, or after the session when positions are traded.
Disclaimer
All figures contained from sources believed to be accurate. All prices stated are based on the last close price at the time of writing unless otherwise noted. Market Matters does not make any representation of warranty as to the accuracy of the figures or prices and disclaims any liability resulting from any inaccuracy.
Reports and other documents published on this website and email (‘Reports’) are authored by Market Matters and the reports represent the views of Market Matters. The Market Matters Report is based on technical analysis of companies, commodities and the market in general. Technical analysis focuses on interpreting charts and other data to determine what the market sentiment about a particular financial product is, or will be. Unlike fundamental analysis, it does not involve a detailed review of the company’s financial position.
The Reports contain general, as opposed to personal, advice. That means they are prepared for multiple distributions without consideration of your investment objectives, financial situation and needs (‘Personal Circumstances’). Accordingly, any advice given is not a recommendation that a particular course of action is suitable for you and the advice is therefore not to be acted on as investment advice. You must assess whether or not any advice is appropriate for your Personal Circumstances before making any investment decisions. You can either make this assessment yourself, or if you require a personal recommendation, you can seek the assistance of a financial advisor. Market Matters or its author(s) accepts no responsibility for any losses or damages resulting from decisions made from or because of information within this publication. Investing and trading in financial products are always risky, so you should do your own research before buying or selling a financial product.
The Reports are published by Market Matters in good faith based on the facts known to it at the time of their preparation and do not purport to contain all relevant information with respect to the financial products to which they relate. Although the Reports are based on information obtained from sources believed to be reliable, Market Matters does not make any representation or warranty that they are accurate, complete or up to date and Market Matters accepts no obligation to correct or update the information or opinions in the Reports. Market Matters may publish content sourced from external content providers.
If you rely on a Report, you do so at your own risk. Past performance is not an indication of future performance. Any projections are estimates only and may not be realised in the future. Except to the extent that liability under any law cannot be excluded, Market Matters disclaims liability for all loss or damage arising as a result of any opinion, advice, recommendation, representation or information expressly or impliedly published in or in relation to this report notwithstanding any error or omission including negligence.


