Shawn’s Trade Idea: Global X Copper Miners ETF (ASX: WIRE) $20.69
In line with our view that copper stocks trend higher through 2027/8 we are happy buyers of any further washout on the downside.

20 minute delayed
Join Market Matters and get full access to all our Opinion + Action
Fund size
$537.2M
NOV 2026
Total cost ratio
0.65%
per year
Distributions
Semi-Annually
Since inception
4.0 yrs
NOV 2022
The Fund aims to provide investors with a return that (before fees and expenses) tracks the performance of the Solactive Global Copper Miners Total Return Index
US equity 9.63%Non-US equity 90.32%
| Asset class | Net % | Long % | Short % |
|---|---|---|---|
| Equity | 99.95 | 99.95 | — |
| Bond | 0.00 | 0.00 | — |
| Cash | 0.05 | 0.05 | — |
| Other | 0.00 | 0.00 | — |
Cyclical 97.75%Sensitive 2.25%Defensive 0.00%
Developed markets 81.02%Emerging markets 18.98%
Size score
205
Value-growth score
204
Economic moat
None 100%Wide 0%Narrow 0%
Giant 15%Large 32%Mid 43%Small 9%Micro 1%
| Holding | % Weight | First bought | Market value | Currency | Units held | Sector | Country | |
|---|---|---|---|---|---|---|---|---|
| Teck Resources Ltd Class B (Sub Voting) TECK.B | 5.96 | NOV 2022 | 47.6M | CAD | 525,352 | Basic Materials | Canada | |
| Hudbay Minerals Inc HBM | 5.65 | NOV 2022 | 45.2M | CAD | 1.4M | Basic Materials | Canada | |
| Southern Copper Corp SCCO | 5.64 | NOV 2022 | 45.0M | USD | 165,354 | Basic Materials | United States | |
| BHP Group Ltd BHP | 5.45 | NOV 2022 | 43.6M | AUD | 757,781 | Basic Materials | Australia | |
| Freeport-McMoRan Inc FCX | 5.24 | NOV 2022 | 41.9M | USD | 446,014 | Basic Materials | United States | |
| Glencore PLC GLEN | 5.10 | NOV 2022 | 40.7M | GBP | 4.0M | Basic Materials | Switzerland | |
| First Quantum Minerals Ltd FM | 4.69 | NOV 2022 | 37.5M | CAD | 1.1M | Basic Materials | Canada | |
| Boliden AB BOL | 4.68 | NOV 2022 | 37.4M | SEK | 510,375 | Basic Materials | Sweden | |
| KGHM Polska Miedz SA KGH | 4.66 | NOV 2022 | 37.2M | PLN | 340,031 | Basic Materials | Poland | |
| Antofagasta PLC ANTO | 4.65 | NOV 2022 | 37.2M | GBP | 597,371 | Basic Materials | United Kingdom |
Fund (NAV) Market price
1M
-14.5
3M
-8.1
6M
-8.2
YTD
0.9
1Y
20.4
3Y
32.4
| Period | Fund (NAV) % | Market price % | Before fees % | Rank in category |
|---|---|---|---|---|
| 1 month | -14.52 | -11.75 | -14.48 | 28 / 21 |
| 3 months | -8.10 | -6.19 | -7.95 | 24 / 20 |
| 6 months | -8.16 | -2.96 | -7.86 | 1 / 17 |
| Year to date | 0.88 | 4.01 | 1.43 | 8 / 15 |
| 1 year | 20.41 | 23.94 | 21.20 | 8 / 15 |
| 3 years p.a. | 32.43 | 33.84 | 33.29 | 17 / 13 |
Returns to 31 OCT 2026, periods of 3 years and longer annualised. Rank is the percentile in the Morningstar category at 30 SEP 2026 (1 = best) over the funds ranked.
Total Capital
2023
11.3
2024
12.9
2025
80.0
| Year | Total % | Capital % | Rank in category |
|---|---|---|---|
| 2025 | 80.04 | 76.78 | 40 / 19 |
| 2024 | 12.91 | 11.03 | 19 / 21 |
| 2023 | 11.34 | 7.19 | 31 / 19 |
FY24
22.1
FY25
2.2
FY26
66.3
| Financial year | Total % |
|---|---|
| Financial year to date | -7.09 |
| Year to 30 JUN 2026 | 66.35 |
| Year to 30 JUN 2025 | 2.18 |
| Year to 30 JUN 2024 | 22.12 |
| 1 year | 3 years | 5 years | 10 years | |
|---|---|---|---|---|
| Alpha | -3.00 | 16.23 | — | — |
| Beta | 1.11 | 1.14 | — | — |
| R-squared | 16.05 | 20.84 | — | — |
| Standard deviation | 48.07 | 35.12 | — | — |
| Sharpe ratio | 0.43 | 0.87 | — | — |
| Sortino ratio | 0.28 | 1.34 | — | — |
| Tracking error | 37.46 | 26.91 | — | — |
| Information ratio | -0.33 | 0.58 | — | — |
| Upside capture % | 45.25 | 135.92 | — | — |
| Downside capture % | 31.74 | 56.99 | — | — |
| Maximum drawdown % | -18.86 | -18.86 | — | — |
Measured against S&P Global Natural Resources TR USD with RBA Bank accepted Bills 90 Days as the risk-free rate, to 31 OCT 2026. Maximum drawdown is on gross returns at the latest quarter end.
Risk score
116.9
Morningstar Portfolio Risk Score at 30 SEP 2026.
2024
0.2
2023
0.3
2022
0.1
| Year | Per unit ($) |
|---|---|
| 2024 | 0.2050 |
| 2023 | 0.2753 |
| 2022 | 0.0927 |
| Ex Date | Per unit ($) |
|---|---|
| 2 JUL 2026 | 0.6649 |
| 31 DEC 2025 | 0.0621 |
| 30 JUN 2025 | 0.1429 |
| 31 DEC 2024 | 0.0192 |
| 28 JUN 2024 | 0.2561 |
| 29 DEC 2023 | 0.0810 |
| 30 JUN 2023 | 0.0117 |
Below Average
ESG risk score
30.41
20.88% of assets are in companies with high or severe controversies.
Carbon risk score
15.60
Announcements
| DATE | TIME | HEADING | PAGES |
| Price sensitive |
In line with our view that copper stocks trend higher through 2027/8 we are happy buyers of any further washout on the downside.
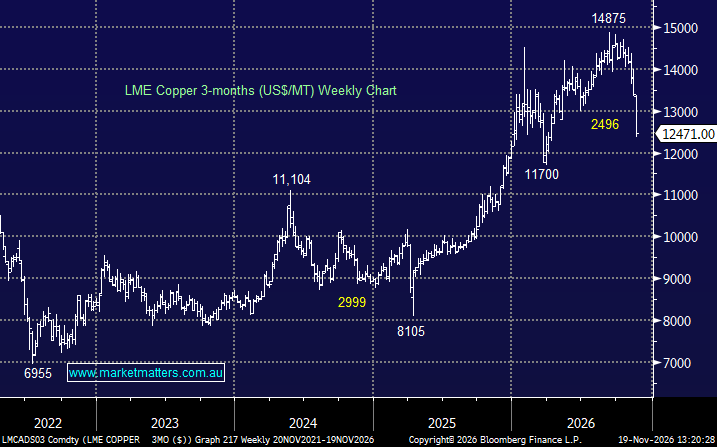
Copper stocks have been hammered recently having been far more correlated to the AI Trade than the underlying industrial metal which has held up well. If we are correct and the AI focused tech unwind is approaching its nadir copper miners should follow suit - hence our purchase of RIO in late October. Over time copper stocks follow the industrial metal as the chart below illustrates - the current disconnect is becoming extreme although again the “Copper Trade” had become crowded as we discussed in recent months.
Same as last week with a tweak as we look to benefit from a spike lower in the coming days/weeks.
We’ve discussed copper stocks several times in today’s report, and we bought RIO on Friday, STI is looking to benefit from a spike lower in the coming days/weeks.
As we touched on earlier while copper drifts lower, the related stocks are getting smacked as we observe a classic unwind of crowded positioning - BHP is set to open down another ~3% this morning, taking it to levels not seen since May and around 20% below its August high, i.e. significantly weaker than the pullback by the industrial metal.
Copper edged 0.6% higher last week to $14,160/t, but the main story was the significant tightening in the physical market. Falling LME inventories, US tariff-related stockpiling and mounting mine disruptions pushed the cash-to-3-month spread to a $416/t backwardation, the widest since 2021 and enough to prompt emergency measures from the LME. The broader backdrop remains supportive, with AI infrastructure demand, constrained supply and fading Fed hike expectations providing tailwinds. The main offset is China, where softer import premiums suggest high prices are beginning to curb demand.
The copper stocks continue lag behind the industrial metal after surging to new highs in January when speculative euphoria spilled over from precious metals into copper. Within the ETF there has been some very differing performances which is common place with miners which can drop the ball operationally: Osisko Metals (+133%), Faraday Copper (+109%), Amerigo Resources (+90%), and BHP (+41%) carrying the bulk of the upside, while the Chinese miners and Ivanhoe Mines have been notable laggards despite copper trading near all-time highs.
We've all read about the bullish tailwinds of the EV transition and AI-driven data centre build-out, with both trends driving demand for the same critical commodities — most notably copper (Cu), and to a lesser extent uranium, lithium and nickel. Cu sits at the centre of both themes, while decade-long mine development timelines continue to constrain new supply, underpinning the case for sustained price strength and potential equity rerating’s for producers. The key risks are weaker Chinese demand, slower EV adoption and AI infrastructure spending falling short of today's lofty expectations - importantly, the crowd is definitely bullish towards copper.
Copper prices edged higher last week which we interpreted as constructive considering the turbulence unfolding in oil prices and the “AI Trade” - one of the industrial metals biggest drivers in recent years has been its role in global electrification: The green energy transition, spanning electricity grids, EVs, and renewables is now considered the primary structural driver of incremental copper consumption growth, with AI infrastructure increasingly cited as an additional demand catalyst.
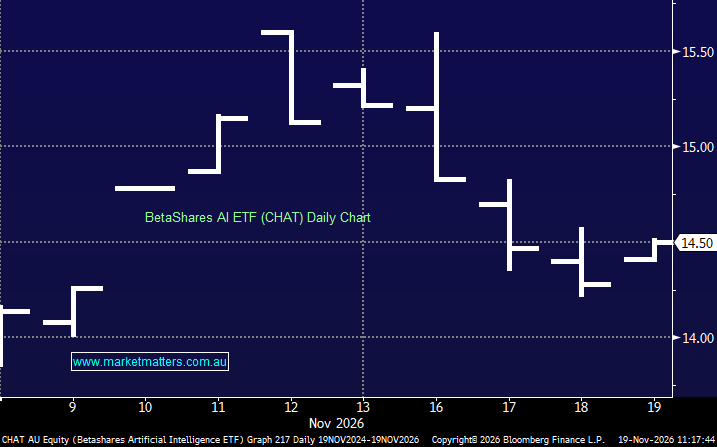
Comex copper (Cu) rallied ~3% overnight sending related stocks sharply higher, including Freeport McMoRan (+5.7%), which we hold in the MM International Equities Portfolio. The news flow remains positive towards the industrial metal, but it was the sharp bounce in the AI Trade which likely improved sentiment in last night's session.
MM is bullish towards copper below US$5.60/lb
MM remains bullish towards copper and its related miners over the coming years
Trade Idea: Buy Global X Copper Miners ETF (WIRE) using a limit of $18.00, with stops at $16.00 around 9% risk.
MM remains bullish towards copper and its related miners over the coming years
MM remains bullish towards copper and its related miners over the coming years
MM is bullish towards the WIRE ETF
MM is bullish towards copper in 2027
MM is bullish towards copper in 2027
Trade Idea: Buy Global X Copper Miners ETF (WIRE) using a limit of $19.50, with stops at $18.20, around 7% risk.
MM remains bullish towards copper and its related miners over the coming years







Forgot password? Request a One Time Password or reset your password
One Time Password
Check your email for an email from [email protected]
Subject: Your OTP for Account Access
This email will have a code you can use as your One Time Password for instant access
A link to create a new password will be sent to the email address you have registered to your account.

Hi, this is only available to members. Join today and access the latest views on the latest developments from a professional money manager.

Our Smart Phone App will give you access to much of our content and notifications. Download for free today.
Hi, this is only available to members. Join today and access the latest views on the latest developments from a professional money manager.
JOIN NOW
Something went wrong. Please try again in a moment.