Portfolio Amendments – Active Income Portfolio
We are making two changes to the Income portfolio today.

20 minute delayed
Join Market Matters and get full access to all our Opinion + Action
Undervalued
Morningstar Quantitative Rating as of 5 NOV 2026.
Quantitative Equity Rating Methodology – view here
Five-star price 18.89 Fair value 22.34 One-star price 26.43
Morningstar Quantitative Rating as of 5 NOV 2026.
Morningstar Quantitative Rating as of 5 NOV 2026. The slider runs from the five-star price (18.89) to the one-star price (26.43).
| Ratios |
|---|
| Currency (Price/reporting): AUD/AUD |
| Exchange Rate: 1.0000 |
| Price - closing or last bid | 16.22 |
| Price - 12 month high | 33.32 |
| Price - 12 month low | 15.77 |
| Pricing date | 5 NOV 2026 |
| Volume - avg. trading volume for the last ten days | 1.01 |
| Market capitalization | 4,592.89 |
| 12 Month High price date | 6 NOV 2025 |
| 12 Month Low price date | 5 NOV 2026 |
| Volume - avg. trading volume for the last 3 months | 0.66 |
| Price - 1 Day % Change | -2.35% |
| Price - 13 week price percent change | -32.53% |
| Price - 26 week price percent change | -31.88% |
| Price - 5 Day % Change | -12.94% |
| Price - 52 week price percent change | -50.61% |
| Price - YTD price percent change | -34.17% |
| Price % Change Month To Date | -10.19% |
| EPS excluding extraordinary items - most recent fiscal year | 0.865 |
| EPS excluding extraordinary items - trailing 12 month | 0.863 |
| EPS Normalized - most recent fiscal year | 0.957 |
| Revenue/share - most recent fiscal year | 49.785 |
| Revenue/share - trailing 12 month | 45.176 |
| Book value per share - most recent fiscal year | 6.576 |
| Book value per share - most recent half-year | 8.355 |
| Book value (tangible) per share - most recent fiscal year | 3.360 |
| Book value (tangible) per share - most recent half-year | -0.181 |
| Cash per share - most recent fiscal year | 1.617 |
| Cash per share - most recent half-year | 4.127 |
| Cash Flow per share - most recent fiscal year | 1.752 |
| Cash Flow per share - trailing 12 month | 3.584 |
| Dividend per share - most recent fiscal year | — |
| Dividends per share - trailing 12 month | 0.750 |
| EBITD per share - trailing 12 month | 2.984 |
| EPS Basic excluding extraordinary items - most recent fiscal year | 0.871 |
| EPS Basic excluding extraordinary items - trailing 12 month | 0.869 |
| EPS including extraordinary items - most recent fiscal year | 0.871 |
| EPS including extraordinary items - trailing 12 month | 0.869 |
| Free Cash Flow per share - trailing 12 month | 3.199 |
| P/E excluding extraordinary items, most recent fiscal year | 18.79 |
| P/E Normalized, most recent fiscal year | 17.02 |
| Price to sales - most recent fiscal year | 0.36 |
| Price to Tangible Book - most fiscal year | — |
| Price to Free Cash Flow per Share - most recent fiscal year | 5.07 |
| Price to Cash Flow per share - trailing 12 month | 4.53 |
| Price to Book - most recent fiscal year | 1.94 |
| P/E excluding extraordinary items high, trailing 12 months | 40.10 |
| P/E excluding extraordinary items low, trailing 12 months | 18.79 |
| Net Debt, LFI | 4,154.94 |
| Net Debt, LFY | 2,599.15 |
| Dividend Yield - 5 Year Average | 4.32% |
| Dividend Yield - indicated annual dividend divided by closing price | 3.92% |
| Current Dividend Yield - Common Stock Primary Issue, LTM | 4.62% |
| Free Cash Flow - most recent fiscal year | 387.74 |
| LT debt/equity - most recent fiscal year | 59.63% |
| Payout ratio - most recent fiscal year | — |
| Total debt/total equity - most recent fiscal year | 154.17% |
| LT debt/equity - most recent half-year | 79.85% |
| Total debt/total equity - most recent half-year | 172.62% |
| Free Cash Flow - trailing 12 month | 867.95 |
| Payout ratio - trailing 12 month | — |
| Revenue - most recent fiscal year | 13,045.19 |
| Revenue - trailing 12 month | 12,256.04 |
| EBITD - most recent fiscal year | 740.99 |
| EBITD - trailing 12 month | 809.41 |
| Earnings before taxes - most recent fiscal year | 393.74 |
| Earnings before taxes - trailing 12 month | 443.44 |
| Net Income available to common - most recent fiscal year | 226.66 |
| Net Income available to common - trailing 12 months | 234.55 |
| Earnings before taxes Normalized - most recent fiscal year | 428.16 |
| Net Income Available to Common, Normalized - most recent fiscal year | — |
| Earnings per Share, Normalized, Excluding Extraordinary Items, Avg. Diluted Shares Outstanding, TTM | 0.95 |
| Net Profit Margin % - 1st historical fiscal year | 2.00% |
| Net Profit Margin % - trailing 12 month | 2.38% |
| Operating margin - 1st historical fiscal year | 4.53% |
| Operating margin - trailing 12 month | 5.26% |
| Pretax margin - trailing 12 month | 3.62% |
| Pretax margin - 1st historical fiscal year | 3.02% |
| Operating Margin - 5 year average | 5.14% |
| Pretax Margin - 5 year average | 4.16% |
| Free Operating Cash Flow/Revenue, 5 Year Average | 3.36% |
| Free Operating Cash Flow/Revenue, TTM | 7.08% |
| Net Profit Margin - 5 year average | 2.95% |
| Return on average assets - most recent fiscal year | 4.53% |
| Return on average assets - trailing 12 month | 3.81% |
| Return on average equity - most recent fiscal year | 17.49% |
| Return on average equity - trailing 12 month | 15.86% |
| Return on average assets - 5 year average | 6.18% |
| Return on average equity - 5 year average | 23.16% |
| Net Income/employee - most recent fiscal year | — |
| Revenue/employee - most recent fiscal year | — |
| Revenue growth rate, 5 year | 8.32% |
| EPS growth rate, 5 year | 9.07% |
| Growth rate% - dividend, 3 year | 4.69% |
| Revenue/share (5 yr growth) | 8.38% |
| Growth rate% - Revenue, 3 year | 15.16% |
| Growth rate% - EPS, 3 year | -9.95% |
| Book value per share growth rate, 5 year | 13.66% |
| Capital Spending growth rate, 5 year | 11.03% |
| Earnings Before Interest, Taxes, Depreciation & Amortization, 5 Year CAGR | 6.74% |
Financial forecast (AUD, millions except per share)
| Actuals | Estimates | |||||||
| 2025 | 2026 | 2027 | 2028 | 2029 | ||||
| Estimate breakdown | ||||||||
Financials (AUD, millions)
| Period end: | DEC 21 | DEC 22 | DEC 23 | DEC 24 | DEC 25 |
| Fiscal year: | 2021 | 2022 | 2023 | 2024 | 2025 |
| Period length: | 12 months | 12 months | 12 months | 12 months | 12 months |
Announcements
| DATE | TIME | HEADING | PAGES |
| Price sensitive |
We are making two changes to the Income portfolio today.
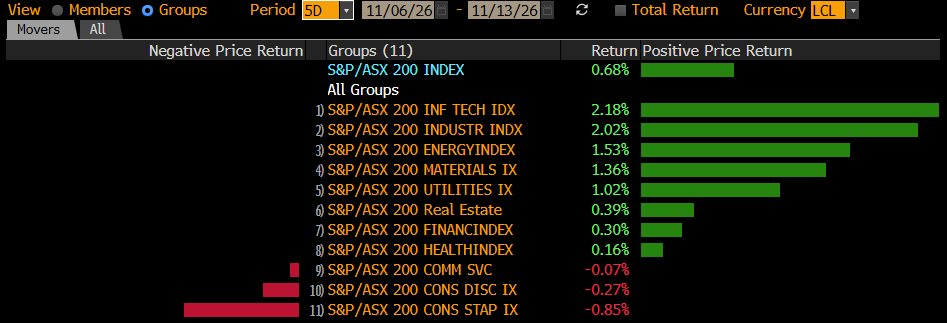
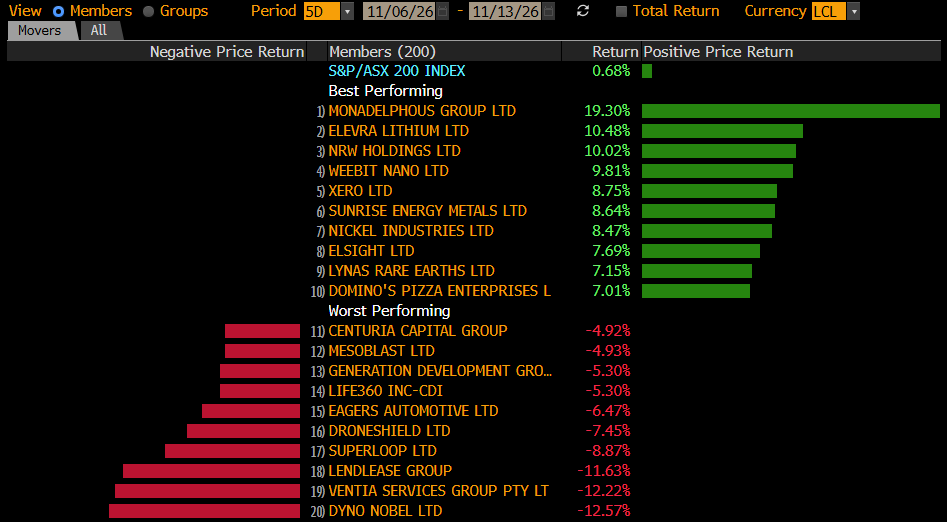
We only recently added Eagers Automotive (APE) to the Income Portfolio and unfortunately walked straight into an earnings downgrade. We initially viewed the subsequent sell-off as excessive given the quality of the business, strength of CanadaOne and continued growth from BYD, but the stock's failure to recover is telling us something. The fundamental momentum has clearly deteriorated with consensus forward EPS cut by around 11%. When earnings revisions are confirmed by price, we need to reduce exposure.
APE –13.22%: Was hit hard today after its trading update highlighted weaker Australian conditions and FY26 revenue guidance came in below expectations.
We are making several changes to the Income Portfolio today.
Eagers (APE) surged almost 8% yesterday after announcing it will acquire the remaining 20% stake in its BYD Retail Joint Venture, a deal expected to be immediately earnings accretive and to complete within days. The acquisition removes the minority partner and gives Eagers full ownership of the economics of its growing BYD dealership business. The expected earnings accretion (~5%) is a positive surprise, particularly after Eagers’ share price weakness over the past year, and provides a near-term tailwind for the stock.
APE -5.08%: Put together a decent1H26 result, the stock traded up initially before giving it back in line with the broader market move. Revenue and underlying operating profit were comfortably ahead of expectations as the acquisition of CanadaOne Auto added scale and the existing Australian and New Zealand operations continued to grow.
Yesterday, in similar fashion to Goodman, Eagers delivered a trading update that saw the stock sharply sold-off before reversing higher (+1.8%) as analysts delved into the details - the stock recovered ~17% from its intra-day spike low under $20. The market's “sell first, and ask questions later” recent characteristic may have caught a few short-term traders this week.
APE has looked good through April being a major beneficiary of increasing EV sales which we discussed earlier in the month Here. The consolidation over the last few weeks, even as the ASX retreated, is a very encouraging sign for the bulls.
The EV tipping point may have just arrived. Second-hand electric vehicle sales more than doubled in March, with 7,557 units sold compared to a monthly average of 3,340 since October — a surge that speaks volumes about how quickly the Middle East conflict is reshaping the way Australians think about getting from A to B.
APE +2.9%: delivered another steady full-year result, as domestic trading conditions continue to hold up well, with new vehicle supply normalising and demand proving more resilient despite higher interest rates.
MM plans to reduce our position in APE in the Income Portfolio
MM is trimming APE in the Active Income Portfolio, reducing to a 2% target weighting~$15.40
MM views todays share price move as an overreaction
MM is buying APE in the Active Income Portfolio, allocating 4% around $19
MM is bullish towards APE around $20
MM remains cautiously bullish toward APE
MM is bullish towards APE around the $22.75 area
Trade Idea: Buy Eagers Automotive Ltd (ASX:APE) at $23.20 with stops at $21.80, around 6% risk
MM is bullish towards APE around $23.50
MM is bullish toward APE

Eagers Automotive is the largest automotive retailing group in the Australian market, with an estimated share of over 16% of new-vehicle sales. The company offers a range of products and services, including the sale of new and used vehicles, vehicle repair services, and parts. The company also facilitates vehicle financing through third-party providers. Additionally, Eagers operates a truck retailing business, offering a similar range of products and services.






Forgot password? Request a One Time Password or reset your password
One Time Password
Check your email for an email from [email protected]
Subject: Your OTP for Account Access
This email will have a code you can use as your One Time Password for instant access
A link to create a new password will be sent to the email address you have registered to your account.

Hi, this is only available to members. Join today and access the latest views on the latest developments from a professional money manager.

Our Smart Phone App will give you access to much of our content and notifications. Download for free today.
Hi, this is only available to members. Join today and access the latest views on the latest developments from a professional money manager.
JOIN NOW
Something went wrong. Please try again in a moment.