Hi Carl,
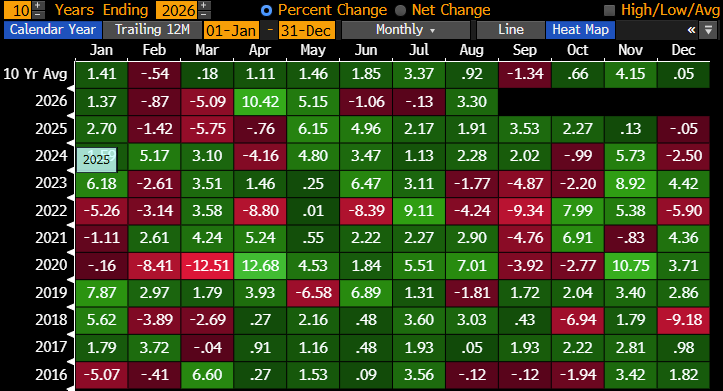
An interesting question, with the patterns also followed by US stocks. The S&P 500 seasonality chart shown below illustrates how the index historically performs well in July, followed by a weak September and then a strong run into Christmas although this shouldn’t come as a major surprise considering the strong correlation between the S&P 500 and the ASX.
Seasonal patterns have persisted across both the ASX and S&P 500 for years due to real mechanical and fundamental drivers:
- Tax-loss selling: Forced selling ahead of tax year-end often weighs on markets before reversing once the selling pressure subsides. This helps explain the US September-October weakness and Australia’s June softness ahead of the 30 June financial year-end, with rebounds often following in October-November (US) and July (Australia).
- Fund flow cycles: Fresh capital deployment creates recurring seasonal tailwinds. New contributions to superannuation and US 401(k) plans, alongside institutional rebalancing, support markets at predictable times. In Australia, EOFY selling in June is frequently followed by July buying as new capital is allocated.
- Earnings calendar: Reporting seasons compress earnings releases, guidance updates and corporate activity into concentrated periods, driving higher volatility. Between reporting seasons, lower news flow can leave markets more dependent on macro developments and investor positioning.
- Holiday liquidity: Reduced trading activity around major holiday periods can amplify price moves. Into year-end, thinner liquidity, lower selling pressure, portfolio “window dressing” and a reluctance to realise gains before year-end all contribute to the seasonal strength often associated with the Santa Claus rally.
- Dividend and buyback calendars: Clusters of ex-dividend dates, dividend payments and share buyback blackout periods alter the balance of market flows, creating recurring periods of relative strength or weakness.
MM Take: Knowledge of seasonality is useful but it’s not a forecasting tool. Calendar effects improve the odds of stronger or weaker periods, but macroeconomic conditions, valuations and investor sentiment remain the dominant drivers of returns in any given year, e.g. 2 of the last 3-years have been strong for the S&P 500.