Hi Glenn,
A great question but like all good equations has a few moving parts:
- The recent APRA superannuation statistics for June showed total assets up by +9.1% and inflows up by +11.2%.
- However, Australia’s population is ageing. Between now and 2050 the number of older people (65 to 84 years) is expected to more than double which will see more people drawing down on their Super as opposed to contributing.
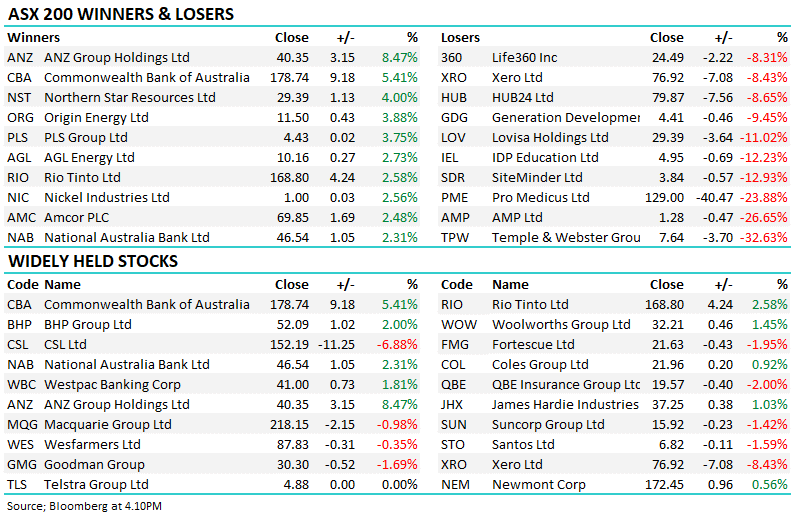
However at the moment Australia’s super sector is headed towards $4 trillion in assets under management, having doubled in the past decade, e.g. super funds hold more than a quarter of all domestic bank stocks and nearly a third of bank short-term debt securities, with their footprint in financial markets continually expanding. The chasing of similar benchmarks is likely to have pushed the likes of CBA to new highs but Big Super is also increasingly expanding its footprint into the likes of infrastructure and direct assets as they search for diversification and returns that are less volatile than say the equity market, though less liquid assets clearly have risks associated with illiquidity. The bigger SF’s get, the harder they find it to generate market beating returns.
- The tsunami of Baby Boomers headed for retirement may pose liquidity issues in time as more customers start drawing down their accounts and net contributions to the sector slows, i.e. selling.
Hence for now Big Super is helping returns but when the dial turns on the Baby Boomers its likely to reverse. The below looks at the current asset allocation of Australian Super’s balanced option, showing where each new $$ is allocated.


