Time for the “BATS” or FANGS”?
The ASX200 slipped -0.4% yesterday which felt like a pretty good performance at 5pm considering the additional tariffs the US has imposed on China i.e. 10% on all goods which will rise to 25% in January. The market clearly voted with both feet that the economic global super powers will have resolved most of their issues by the new year. The relatively soft 10% to begin with clearly gave markets optimism that the US is looking to negotiate moving forward.
Under the hood the damage was primarily felt in the energy and high valuation growth stocks e.g. Afterpay (APT) -5.1%, Altium (ALU) -4.3%, Wisetech Global (WTC) -3% and Origin (ORG) -2.9%. The overnight negative lead from the US high growth / IT NASDAQ falling -1.5% clearly had more impact locally than the latest round of trade shenanigans – at MM we believe the volatility in the growth space will be ongoing into 2019.
· MM remains negative the ASX200 with an initial target sub 6000.
Overnight stocks were stronger in the US following Asia’s afternoon recovery as interpretations of Trumps latest trade move became more positive – equities remain convinced that the US / Trump will get a positive outcome on trade with China.
Today’s report is going to look at two high profile groups of stocks the “BATS” and “FANGS” and importantly any opportunities that may be presenting themselves in the current environment. Looking globally, there has been some huge disparity in global markets with strength in the US overshadowing extreme weakness in emerging markets. That disparity can often create opportunity in areas that we haven’t generally focussed too heavily on in notes previously. As part of the outgoing developments for Market Matters, actionable insights in international equities and thematic ETFs will feature more regularly.
“BAT’s” – Baidu (BIDU), Alibaba (BABA) and Tencent Holdings (TCEHY), plus Samsung for good measure.
“FANG’s” – Facebook (FB), Amazon (AMZN), Netflix (NFLX) and Google Alphabet (GOOGL) plus APPLE (AAPL) for balance.
We’ll cover these 9 stocks fairly succinctly this morning…
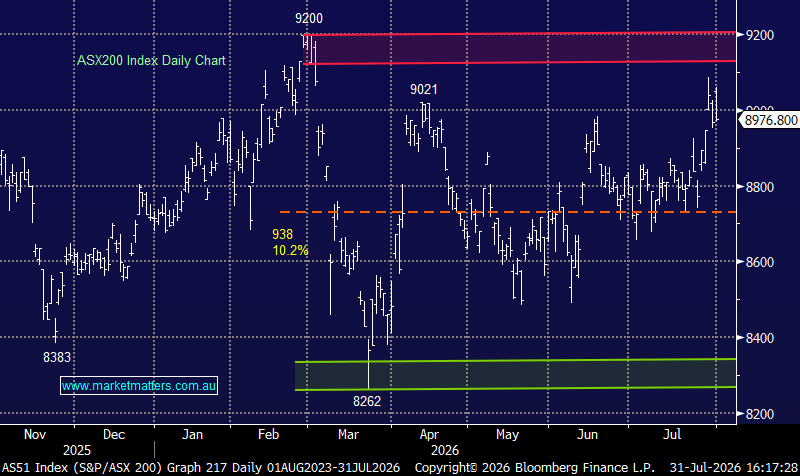
ASX200 Chart – the last two weeks on the ASX has been less than inspiring as the market edged up reluctantly

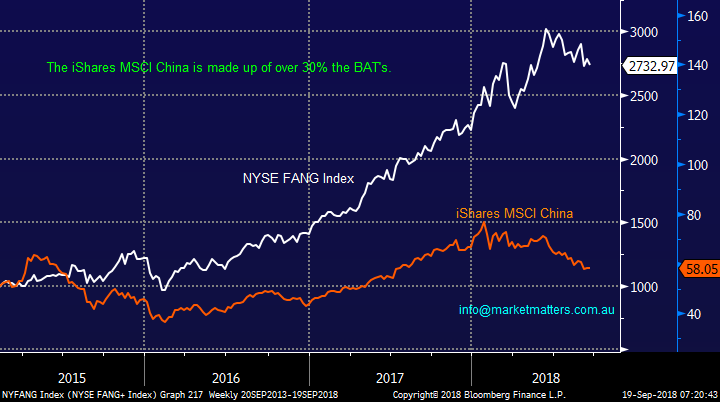
It’s very evident when we look at the below chart that the FANG’s have significantly outperformed the BAT’s over recent years and especially this calendar year with China’s index making fresh 4-year lows during today’s session. – the FANG’s have actually been great performers both in the US and on the international stage.
NB While the below iShares MSCI China ETF is by no means a perfect representation of the BAT’s they make up 3 of the 4 largest stocks in the ETF – Tencent 15.2%, Alibaba 12.1% and Baidu 3.9%.
Comparing the FANGS to the BAT’s Chart
“BATS” v “FANGS”.
Firstly, lets summarise each of the stocks for those who are not familiar with some of the lesser known Asian names:
- Baidu (BIDU) US – a Chinese multinational company specializing in internet services, products and artificial intelligence. Trades in the US on a P/E of 21.3x with a market cap of $US76.2bn.
- Alibaba (BABA) US – a Chinese multinational company specializing in internet infrastructure, e-commerce, and online financial / content servicers through its subsidiaries. Trades in the US on a P/E of 29.1x with a market cap of $US411.9bn.
- Tencent (700 HK) HKD – a huge investment holding company providing internet services, advertising, e-commerce, gaming etc. Trades in Hong Kong on a P/E of 32.4x with a market cap of $HKD3,028bn.
- Samsung (005930 KS) KRW – a household name which trades in South Korea on a Est P/E for 2018 of 6.35x with a market cap of KRW292,079bn.
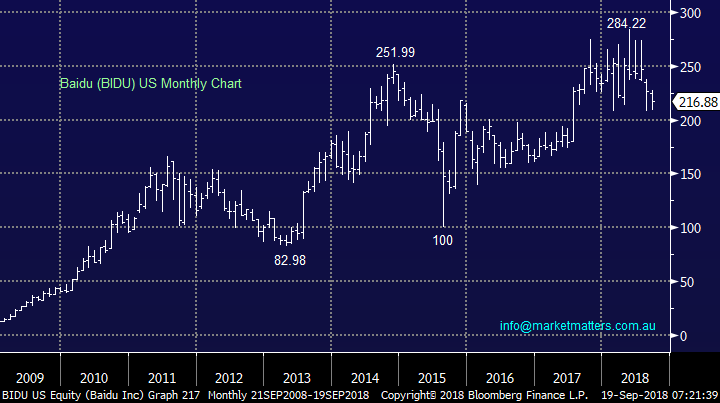
Baidu (BIDU) $US216.88
Baidu is China’s most popular search engine which is now moving into artificial intelligence and self-drive cars – not surprisingly its often referred to as China’s Google. An internet dream story that was founded in Beijing hotel room in the year 2000, its main revenue comes from advertising, similar to Google AdWords and it already generates more revenue than Netflix or eBay.
However like others Baidu is vulnerable to China’s strict online censorship laws making the future a bit opaque but with only ~50% of the Chinese population on Baidu growth should continue, especially with Google banned in China.
Technically BIDU is currently neutral making decent / risk reward tricky for believers in the company, which is an easy place to be:
Either buy at current levels with stops below 190, or buy / add into fresh highs above $US300 with stops below $US280.
Baidu (BIDU) US Chart
Alibaba (BABA) $US156.55
Alibaba (BABA) is a Chinese internet behemoth that combines internet and artificial intelligence which last month announced they had grown revenue over 60% on a year on year basis and free cash flow over 400% in just 4-years – clearly some big numbers.
We like BABA given it provides direct exposure to the Chinese middle class, a huge growing demographic with increasing purchasing power - a thematic we believe in at MM.
Trade war fears have taken down Alibaba shares plus the looming retirement of founder Jack Ma to focus on philanthropy.
MM regards the recent ~27% pullback as an excellent accumulation opportunity in this high quality business on a reasonable valuation.
Alibaba (BABA) US Chart

Tencent (700HK) HKD318
In August, Tencent’s profit fell for the first time in 30-years sending the stock down 6% raising the obvious question, has it become ex-growth, the 32.4x Est. P/e suggests investors think not.
Chinese regulators becoming more involved in the growing gaming industry has concerned many, especially their order of Tencent to stop selling the popular game “Monster Hunter World” – we wonder if these headwinds might become tailwinds in a trade war as the Chinese government would look to support their own!
In just 3 months to June the company’s revenues grew to $US10.6bn and although it was a 30% increase, it was the slowest growth since Q2 2015. The goliath owns many businesses like WeChat but 40% of its revenue comes from online gaming hence the impact of the regulators – a bit like a royal commission locally.
At MM we believe the current 35% pullback is an opportunity to start accumulating Tencent into weakness.
Tencent (700 HK) HKD Chart

Samsung Electronics (005930 KS) KRW45,500
Samsung has been a pretty poor performer amongst the global techs this year falling well over 20% from its late 2017 highs. The South Korean household name suffered from a slowing / more competitive smartphone market plus serious worries over memory and semiconductor prices. The semiconductor division is actually the companies talisman contributing to almost 80% of profits hence margin concerns here are a very real issue.
Our view is that these issues plus general selling of Asian tech names is providing a buying opportunity in the stock which is trading on an extremely low valuation compared to its global peers.
MM likes Samsung at today’s prices
Samsung Electronics (005930 KS) KRW Chart

Now moving onto the household names that the US market has so regularly provided over the last decade.
- Facebook (FB) US – social media goliath now has a market cap of $US463bn while it trades on a P/E of 22.4x.
- Amazon (AMZN) US – The online retailer now has a market cap of $US930bn while it trades on a P/E of 108.14x.
- Netflix (NFLX) US – the internet subscription business now has a market cap of $US152bn while it trades on a P/E of 129x.
- Google Alphabet (GOOGL) US – the search engine business now has a market cap of $US805bn while it trades on a P/E of 29.3x.
- APPLE (AAPL) US – the iPhone and iPad maker now has a market cap of $US1,052bn, over 1 trillion, while it trades on a P/E of 18.6x.
We have simply updated our views on these 5 household.
Facebook (FB) $US160.30
We are now neutral / bearish FB following its large correction. From a ‘layman’ perspective, it seems to us that people are using Facebook less and the move to monetise the user base, like a lot of these social media platforms is a more difficult / complicated task than first thought. Commercialising a social platform that wasn’t designed for commercialisation in the first instance is tough, while we also think FB has created many underlying social problems that with manifest into tighter regulation in the future.
MM is not keen on FB initially targeting the $US150 area.
Facebook (FB) US Chart

Amazon (AMZN) $US1941.05
The amazing online retailer continues to go from strength to strength and clearly it’s hard to fault the share price trends below. While the market is not focussed on valuation at the moment, instead looking at top line sales growth which is tracking at around ~30% annually, at some point. While we are cautious its large 108x Est P/E, on forecasted numbers, this drops substantially by FY20 given a doubling of projected profits.
We are neutral Amazon but would consider buying technically around the 1800 area, or 7% lower.
Amazon (AMZN) US Chart

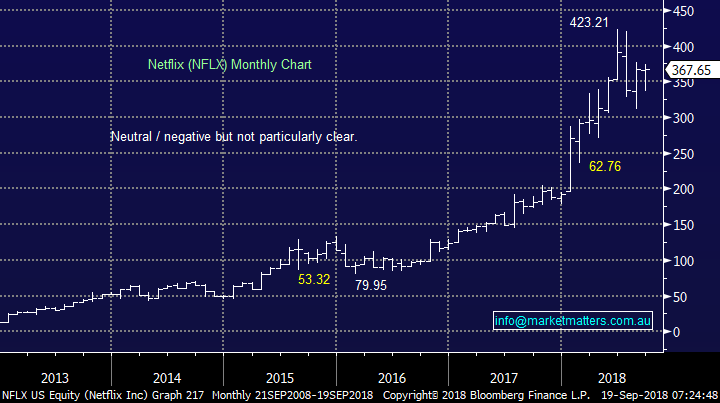
Netflix (NFLX) $US367.65
Netflix has had a relatively tough time compared to the sector with a few headwinds impacting its performance – when you’re trading on an Est. P/E of 129x there is no room for error!
MM is neutral at present.
Netflix (NFLX) US Chart
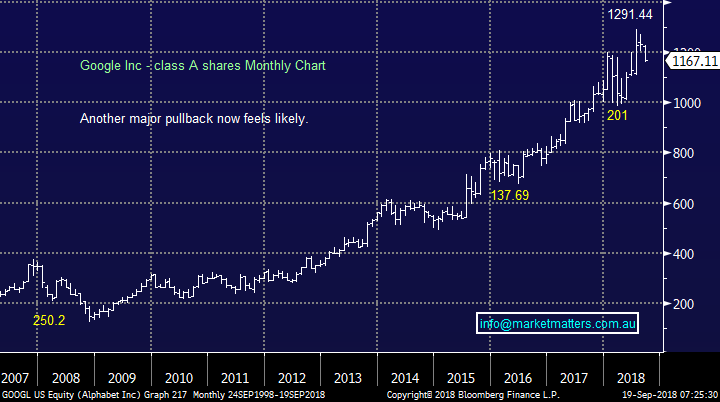
Google Alphabet (GOOGL) $US1167.11
Google shares have started “wobbling” recently and on balance we are now slightly negative targeting the $US1000 support area where the stock has spent much of 2018.
MM is an interested buyer but only ~10% lower.
Google Alphabet (GOOGL) US Chart
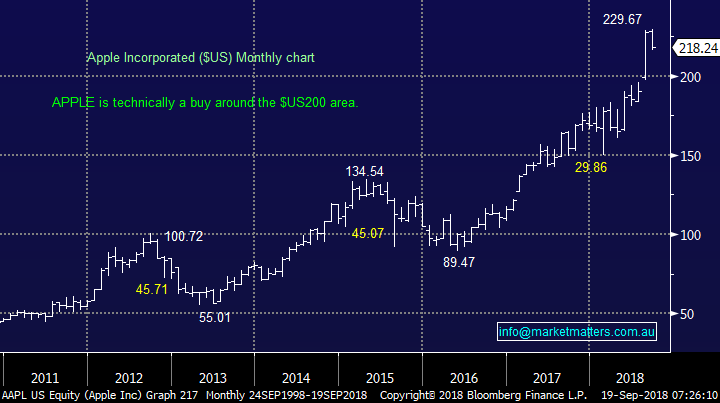
APPLE (AAPL) $US218.24
APPLE continues to trade from strength to strength as the business evolves very impressively– APPLE’s cash plie is now approaching $US300bn, meaning that it could almost BUY the big 4 banks in Australia outright!
MM likes APPLE in the $US200 region.
APPLE (AAPL) US Chart
Conclusion
When we compare the 2 respective regions two things catch our eye:
- The recent average pullback by the BAT’s is 28% compared to 13% by the US names.
- The average valuation of the US names is not significantly higher as we were expecting when starting this piece - with the exception of Netflix and Amazon.
We have listed the 8 stocks in order of preference and included ideal buying area:
1. Samsung Electronics (005930 KS) accumulate in current weakness.
2. Tencent (700 HK) accumulate in current weakness.
3.Alibaba (BABA) accumulate in current weakness.
4. APPLE (AAPL) a keen buyer in the $US200 region.
5. Google (GOOGL) a keen buyer but only ~10% lower.
6. Amazon (AMZN) a buyer around the $US1800 area.
7. Baidu (BIDU) could consider buying further weakness or fresh highs.
8. Netflix (NFLX) no real interest at present.
9. Facebook (FB) – no real interest.
Overseas Indices
The US Russell 2000 continues to hold above the important 1700 support, we are neutral at current levels.
US Russell 2000 Chart

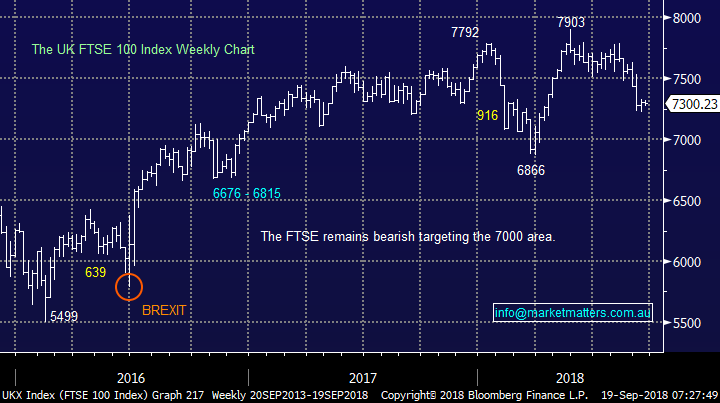
European indices were marginally higher overnight but we remain net the bearish the region.
UK FTSE Chart
Overnight Market Matters Wrap
· The global markets gained overnight as the China’s retaliation to the current US tariffs were not as bad as most expected.
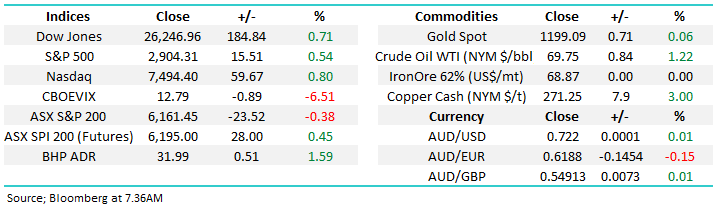
· The Aussie battler continued to rally from yesterday afternoon to settle this morning above the US72c handle, with the major miners ending their session in the green.
· BHP is expected to outperform the broader market following the positive US-China news and after ending its US session up and equivalent of 1.59% from Australia’s previous close.
· The September SPI Futures is indicating the ASX 200 to open 34 points higher, testing the 6200 level this morning.
Have a great day!
James & the Market Matters Team
Disclosure
Market Matters may hold stocks mentioned in this report. Subscribers can view a full list of holdings on the website by clicking here. Positions are updated each Friday, or after the session when positions are traded.
Disclaimer
All figures contained from sources believed to be accurate. Market Matters does not make any representation of warranty as to the accuracy of the figures and disclaims any liability resulting from any inaccuracy. Prices as at 19/09/2018
Reports and other documents published on this website and email (‘Reports’) are authored by Market Matters and the reports represent the views of Market Matters. The MarketMatters Report is based on technical analysis of companies, commodities and the market in general. Technical analysis focuses on interpreting charts and other data to determine what the market sentiment about a particular financial product is, or will be. Unlike fundamental analysis, it does not involve a detailed review of the company’s financial position.
The Reports contain general, as opposed to personal, advice. That means they are prepared for multiple distributions without consideration of your investment objectives, financial situation and needs (‘Personal Circumstances’). Accordingly, any advice given is not a recommendation that a particular course of action is suitable for you and the advice is therefore not to be acted on as investment advice. You must assess whether or not any advice is appropriate for your Personal Circumstances before making any investment decisions. You can either make this assessment yourself, or if you require a personal recommendation, you can seek the assistance of a financial advisor. Market Matters or its author(s) accepts no responsibility for any losses or damages resulting from decisions made from or because of information within this publication. Investing and trading in financial products are always risky, so you should do your own research before buying or selling a financial product.
The Reports are published by Market Matters in good faith based on the facts known to it at the time of their preparation and do not purport to contain all relevant information with respect to the financial products to which they relate. Although the Reports are based on information obtained from sources believed to be reliable, Market Matters does not make any representation or warranty that they are accurate, complete or up to date and Market Matters accepts no obligation to correct or update the information or opinions in the Reports. Market Matters may publish content sourced from external content providers.
If you rely on a Report, you do so at your own risk. Past performance is not an indication of future performance. Any projections are estimates only and may not be realised in the future. Except to the extent that liability under any law cannot be excluded, Market Matters disclaims liability for all loss or damage arising as a result of any opinion, advice, recommendation, representation or information expressly or impliedly published in or in relation to this report notwithstanding any error or omission including negligence.