Is it time for iron ore or gold, or both? (FMG, RIO, BHP, NCM, NST, SAR)
The ASX200 enjoyed another strong day at the office to kick-off the week, even while all the banks operating in Australia slipped lower, an interesting read through is that the sector is going to struggle due to mounting bad debts courtesy of COVID-19 yet the majority of the market is starting to price in an almost perfect “V-shaped” recovery. In our opinion this is arguably a contradiction but we feel the trend is far too ingrained to start fading, just yet, as we said in the Weekend Report the Value Index might just come into its own in Q4 of this year, in other words we feel it’s time to be patient with regard to increasing exposure to Australian Banks.
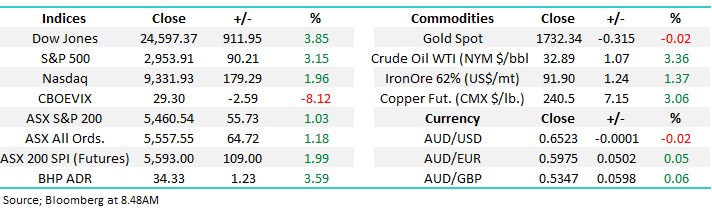
Following a 911-point rally by the Dow overnight the local market is poised to soar over 100-points this morning to challenge its recent high, yet again the local index has “picked” the overseas markets perfectly, it will be interesting to see if investors take some $$ off the table today.
With public schools in NSW returning next week its not surprising that optimism is rising yet by definition investors are also betting that banks will suffer a surge in bad debts from falling property prices and collapsing small businesses, not what you associate with an economy about to bounce off a government stimulus fuelled springboard, a fascinating oxymoron. We feel property will hold up ok with interest rates approaching zero, plus the papers have been reporting a strong uptick in Chinese buying, another interesting scenario for the government who simply cannot afford Australian property to fall too hard. However personally I would be cautious towards units in areas threatening oversupply as developers are being encouraged to get back building.
Ideally MM wants to see fresh 2020 lows for the Banks before we consider averaging.
ASX200 Index v the Banking Sector Chart

Under the hood on Monday we may have seen over 70% of the ASX200 rally but it was the Resources Sectors that led the charge from iron ore, gold and energy all enjoying a particularly strong day – its not often that you see the likes of BHP Group (BHP), Rio Tinto (RIO), Fortescue Metals (FMG) and Newcrest Mining (NCM) all advance by close to 5%, or more. We will delve into some of these names later in today’s report.
On an index level we remain positive the ASX looking for fresh recent highs, my best guess is around 5% higher before investors start reassessing the risk / reward but with so few names doing the “heavy lifting” it’s beyond guesswork to be confident on targets, just follow the flow - the SPI futures have us opening up around 2% this morning. We see 2 events potentially unfolding this financial year, only 6-weeks left, which may cause both a swing high and low in the local market:
1 – FOMO: Financial markets have absorbed plenty of bad news while capital raisings and bond issuances have in the main been hoovered by the market illustrating that it’s a very dangerous game to fight a liquidity driven rally. We feel a “Fear of Missing Out” surge in the market is just commencing which will in all likelihood take stocks to fresh recent highs above the 5550 handle – these levels could even be challenged today.
2 – Banks washout: Equities will endure another 5-10% pullback at some stage in the coming months, that’s the usual rhythm of equities and especially with elevated volatility after the plunge in March. If the banks cannot get involved in the current advance its highly unlikely, they will avoid being caught up in the selling hence a pullback might be deeper than many envisage simply because of the banks index weighting.
Ultimately MM remains bullish equities both short & medium-term.
ASX200 Index Chart

One concern I still have for global equities is we have once again become complacent with regards to COVID-19, strange when you consider second waves are seriously hindering the recovery through Asia. In China alone 100 million people in the Northeast have been moved back into lockdown, clearly China is taking a hard line on any signs of a potential outbreak.
President Trump has dealt with the COVID-19 pandemic in a questionable fashion (I’m being deliberately diplomatic) hence with the November election looming fast he seems destined to succeed in getting the US back to work as fast as possible, an admirable goal but by definition it comes with plenty of risks.
Hence while we remain bullish towards stocks medium-term, we still anticipate spikes of volatility throughout 2020 – “buy weakness & sell strength”.
Confirmed cases of the Coronavirus in the US Chart

Last night an interesting thought crossed my mind as I skimmed the financial press – many headlines in the local papers were along the lines of “Super funds smashed by the coronavirus”. I’m not sure what people expected when the ASX plunges almost 40% in just a few weeks due to an unprecedented modern-day pandemic. However, I feel fund managers might feel obligated to buy more downside protection in the years ahead pushing up volatility in the process i.e. an increased appetite / demand for Put Options pushes up the VIX, its simply supply & demand.
MM is bearish the VIX over the next year but a spike down into the 23-25% region may end the retracement for a while.
The VIX (volatility) Index Chart

Overseas equities
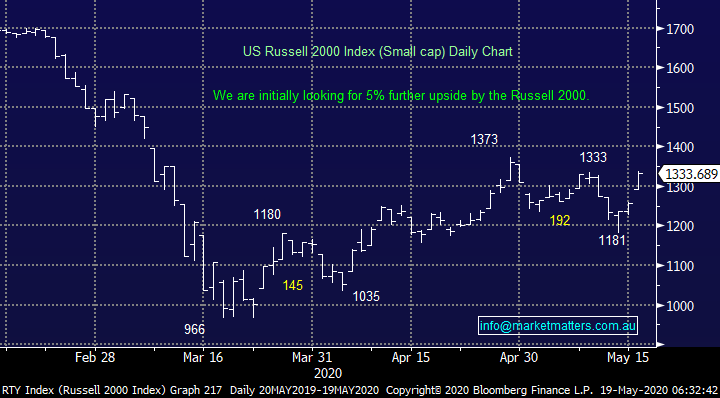
Overnight US stocks surged higher ignited by Fed chair Jerome Powell stating that the “Fed is not out of ammo” plus some encouraging vaccine trial results which had investors focusing on the global economic engine returning to full steam ahead sooner rather than later. Our pullback targets were achieved last week in both the US and Europe turning us short-term bullish which was clearly on the money, we remain mildly bullish global equities short-term looking for 5% further upside from the Russell 2000 small-cap index but the larger cap S&P500 has already achieved our minimum target area.
MM remains bullish global stocks medium-term.
US Russell 2000 (Small Cap) Index Chart
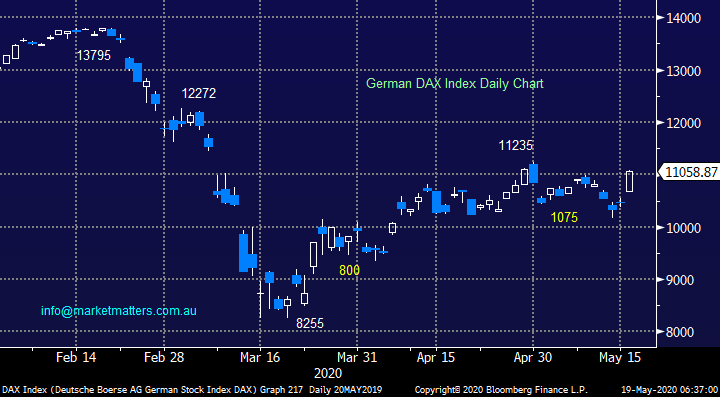
European Indices like our own have been lagging the likes of the tech-based NASDAQ and S&P500 but they remain bullish with a further ~4% looking on the cards.
MM is considering where to take some $$ “off the table” into the current market surge.
German DAX Index Chart
Is it the time for iron ore or Gold?
Initially I have taken a quick look at iron ore as its getting headlines this morning plus we gave away our bullish bias towards gold in the Weekend Report but is it due a rest?
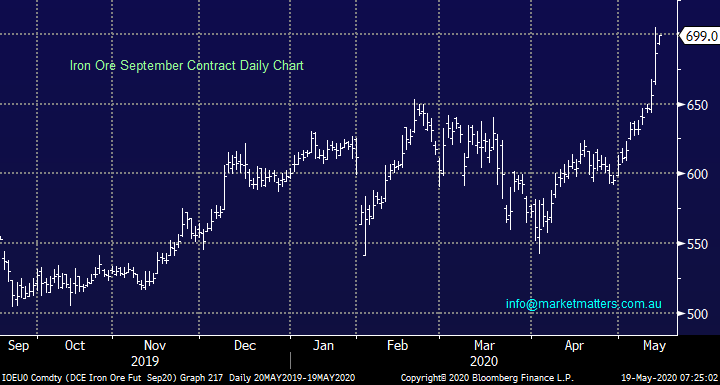
Iron Ore (CNY/MT)
Iron ore has been rallying strongly since Q4 of 2018 but the last month has been explosive due to concerns around Brazils production under the COVID-19 cloud, short-term we caution investors against chasing this euphoria, especially after it made the papers today! We’ve seen it before with the likes of nickel and aluminium and in both cases, it led to major tops in the commodity and respective stocks. However, at this stage analysts have been slow to accept / acknowledge the rising prices hence begrudging upgrades should flow through the market supporting major players into any pullbacks.
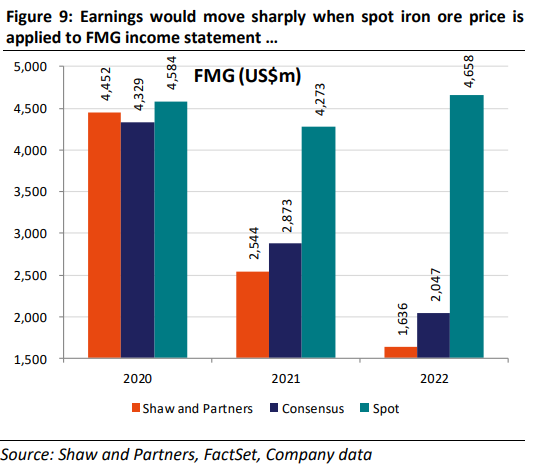
This chart from Shaw and Partners shows Iron Ore Spot Price (green) versus analysts’ consensus (Orange) and Peter OConnors forecasts (Blue). The market is clearly bearish Iron Ore in the coming years yet spot prices remain elevated.
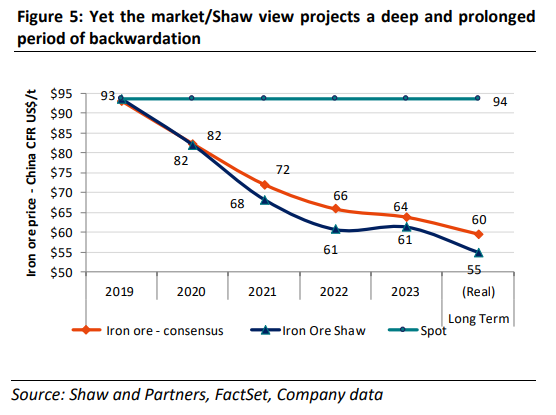
Using Fortescue Metals (FMG) as an example, plugging in spot Iron Ore prices rather than consensus price forecasts results in significant upgrades, ~50% in 21 & ~120% in 22.
At MM being long iron ore ties in nicely with our medium-term outlook for stimulus fuelled global growth, inflation and Value Stocks coming back into vogue, the question is after recent gains where is the best place for our hard earned money.
MM is bullish iron ore medium-term.
Iron Ore (CNY/MT) Chart
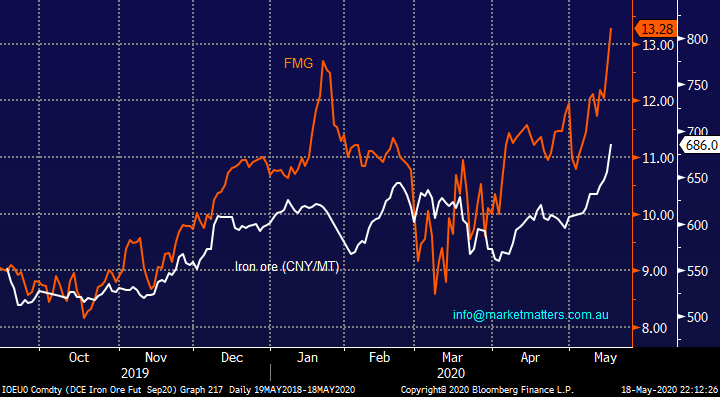
Today’s headline at 7am in the Financial Review was coincidentally “How China could stoke iron ore prices” however considering prices have already been rallying steadily all year plus Fortescue made all-time highs yesterday the article is questionably timed. The bulk commodity has been enjoying both supply and demand tailwinds, the perfect scenario for any market:
1 – Demand: Chinese demand remains strong and huge global fiscal stimulus flowing through in the years ahead should keep this side of the equation supportive for a while. One strong indicator of this has been Steel production in April, the 3rs strongest month on record.
2 – Supply: Brazil produces over 20% of the worlds iron ore and with their COVID-19 cases now higher than Italy, major disruptions are envisaged – this tailwind is likely to be relatively short-lived
To put things into perspective the Resources Sector now looks likely to match the Banking Sector this financial year with regard to dividends as these cash cows pump out the profits - an attractive scenario for the average Australian Retail Investor, one of the reasons for the significant exposure in the MM Growth Portfolio.
Medium-term MM remains bullish and overweight the Australian Resources Sector.
Iron Ore v Fortescue Metals (FMG) Chart
RIO Tinto (RIO) $90.30
Diversified miner RIO’s Australian iron ore division delivered more than half of the company’s revenue in 2019 but the stock has languished compared to FMG in 2020 as analysts have forecasted an end to recent years earnings growth with iron ore prices forecast to fall – wrong! RIO is forecast to yield around 5% fully franked this calendar year making it extremely attractive to the income hungry, especially as the banks are taking a “rest” on this front. We are bullish RIO initially looking for another 15% upside.
Considering the current euphoria around the iron ore price I like the concept of gaining exposure via a diversified play such as RIO.
MM is bullish RIO.
RIO Tinto (RIO) Chart

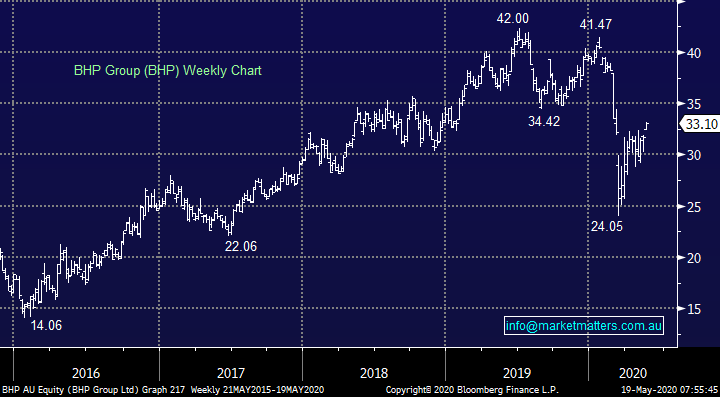
BHP Group (BHP) $33.10
Australia’s 3rd largest company is looking great at present as it enjoys tailwinds from both iron ore and crude oil, with the later rallying over 6% overnight helping BHP rally another $1.20 in the US. We believe this rally is only just getting going, especially from the comparative performance perspective with our initial target for the old “Big Australian” back up towards $40.
Again, in a similar manner to RIO we like the concept of gaining exposure via a diversified play.
MM is bullish BHP.
BHP Group (BHP) Chart
Conclusion
MM is bullish the iron ore sector moving forward but at today’s levels our order of preference is RIO, BHP and then high flyer FMG.
Gold $US1733/oz
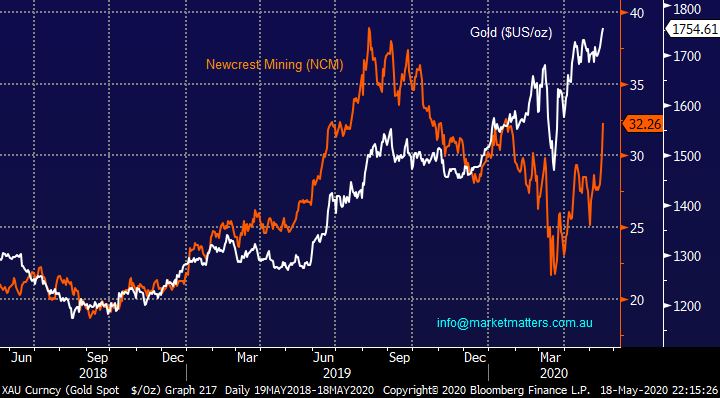
Gold has frustrated MM over the last 12-months more on a stock level as opposed to the precious metal itself which has rallied steadily for the last 18-months. Unfortunately the local stocks have underperformed their global peers with heavyweight Newcrest Mining (NCM) by far the worst, it’s still significantly down since last July yet the precious metal has advanced by ~20%, a great illustration that picking the sector to buy is only half the battle e.g. Evolution (EVN) has advanced by more than 3x NCM over the last year.
However all is not doom and gloom with the outlook for US real rates (staying low/negative) and the correlation of this to the $US gold price has led MM to update our gold outlook with bottom line being we envisage a $US$2,000 in the coming 1-2 years.
The conclusion is simple, we are bullish gold with the underlying question where and via what stock (s) do we want to gain exposure – read on Macbeth!
Gold ($US/oz) v Newcrest Mining (NCM) Chart
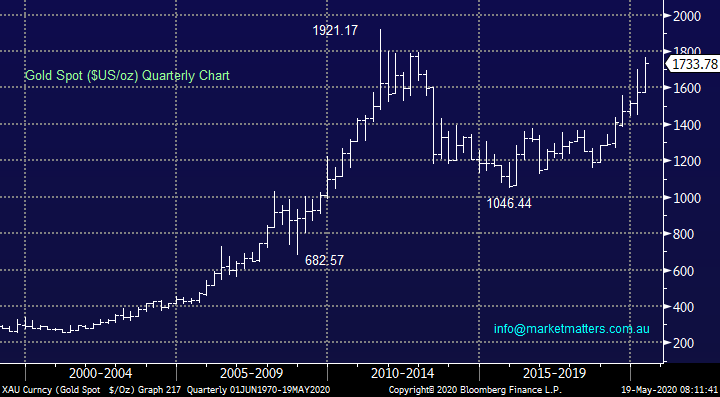
Gold in a similar manner to iron ore has rallied steadily over recent years and it now sits less than 10% below its all-time high. Gold has enjoyed its safe haven status but the largest driver in our opinion is central banks being able to borrow money at negative interest rates allowing them to purchase gold with no / positive “cost of carry” - Russia is one example that’s been active increasing their gold reserves. Also, we believe inflation will ultimately pick up in the next few years thanks to record pump priming adding fuel to this already hot sector.
Importantly the negative real rate and gold price journey will likely be a multi-year phenomena Gold price and gold related equities will trend & stay higher for as long as the current, and projected, price tailwinds, continues. While we anticipate a pullback at some stage after strong gains, we are keen buyers of such moves as opposed to looking for areas to fade the markets recent strength.
MM remains bullish gold.
Gold ($US/oz) Chart
Newcrest Mining (NCM) $32.26
We have been a major critic of NCM in the past but we now believe it’s time to put our grievances behind us and state we believe NCM is now going a lot higher, probably to challenge the $40 area. This is not the time to be looking in the rear-view mirror, if it is going up buy, its simple.
MM is bullish NCM.
Newcrest Mining (NCM) Chart

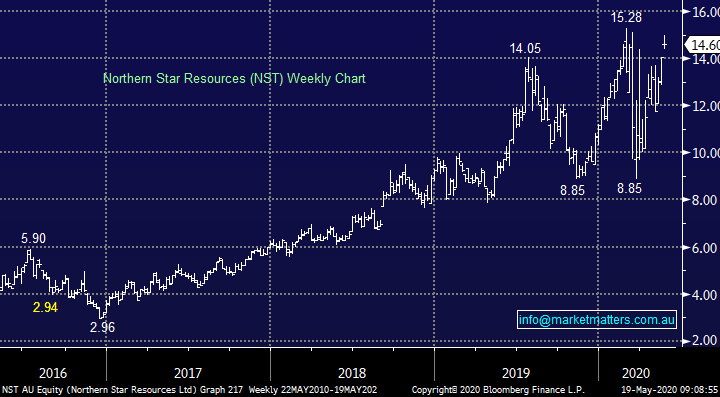
Northern Star Resources (NST) $14.60
NST is our preferred stock in the sector and we can see it exploding higher in similar fashion to SAR shown next, we could see the $20 area easily.
MM is bullish NST.
Northern Star Resources (NST Chart
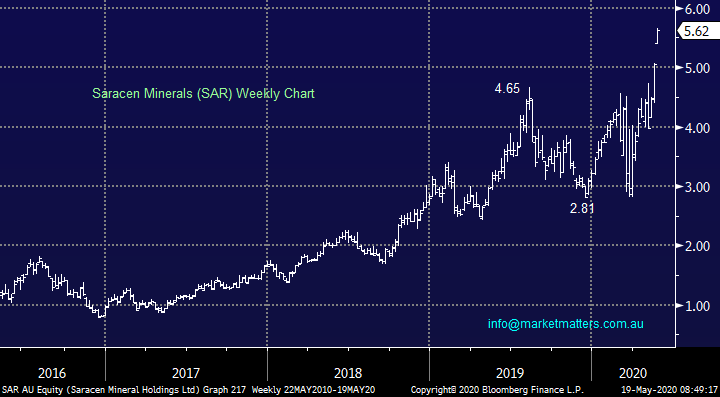
Saracen Minerals (SAR) $5.62
I have put SAR in today’s section to show how Australian stocks can explode higher when the buying kicks in, we believe many others will follow suit as investors look for perceived “cheap options” to gain exposure to gold.
MM is bullish SAR.
Saracen Minerals (SAR) Chart
Conclusion
MM is bullish the gold sector with NCM one of our top picks – yes we did say NCM! However, there are also 2 important points we will be considering as we look to buy into the sector:
1 – We don’t want to go all in at current levels, hence allowing us to buy any pullbacks in a relaxed fashion.
2 – Ideally, we would look to buy a couple of stocks to minimise stock specific risk with NCM and NST current picks.
Overnight Market Matters Wrap
- Risk was certainly back on the table overnight following promising early results from an experimental vaccine
- Crude oil climbed, currently sitting at US$32.89/bbl. following the news above, as did Dr. Copper at US$240.50/lb.
- BHP is expected to outperform the broader market after ending its US session up an equivalent of 3.59% from Australia’s previous close.
- The June SPI Futures is indicating the ASX 200 to open 134 points higher, testing the 5600 level this morning.
Have a great day!
James & the Market Matters Team
Disclosure
Market Matters may hold stocks mentioned in this report. Subscribers can view a full list of holdings on the website by clicking here. Positions are updated each Friday, or after the session when positions are traded.
Disclaimer
All figures contained from sources believed to be accurate. All prices stated are based on the last close price at the time of writing unless otherwise noted. Market Matters does not make any representation of warranty as to the accuracy of the figures or prices and disclaims any liability resulting from any inaccuracy.
Reports and other documents published on this website and email (‘Reports’) are authored by Market Matters and the reports represent the views of Market Matters. The Market Matters Report is based on technical analysis of companies, commodities and the market in general. Technical analysis focuses on interpreting charts and other data to determine what the market sentiment about a particular financial product is, or will be. Unlike fundamental analysis, it does not involve a detailed review of the company’s financial position.
The Reports contain general, as opposed to personal, advice. That means they are prepared for multiple distributions without consideration of your investment objectives, financial situation and needs (‘Personal Circumstances’). Accordingly, any advice given is not a recommendation that a particular course of action is suitable for you and the advice is therefore not to be acted on as investment advice. You must assess whether or not any advice is appropriate for your Personal Circumstances before making any investment decisions. You can either make this assessment yourself, or if you require a personal recommendation, you can seek the assistance of a financial advisor. Market Matters or its author(s) accepts no responsibility for any losses or damages resulting from decisions made from or because of information within this publication. Investing and trading in financial products are always risky, so you should do your own research before buying or selling a financial product.
The Reports are published by Market Matters in good faith based on the facts known to it at the time of their preparation and do not purport to contain all relevant information with respect to the financial products to which they relate. Although the Reports are based on information obtained from sources believed to be reliable, Market Matters does not make any representation or warranty that they are accurate, complete or up to date and Market Matters accepts no obligation to correct or update the information or opinions in the Reports. Market Matters may publish content sourced from external content providers.
If you rely on a Report, you do so at your own risk. Past performance is not an indication of future performance. Any projections are estimates only and may not be realised in the future. Except to the extent that liability under any law cannot be excluded, Market Matters disclaims liability for all loss or damage arising as a result of any opinion, advice, recommendation, representation or information expressly or impliedly published in or in relation to this report notwithstanding any error or omission including negligence.


