IGO Ltd (ASX: IGO) $7.03
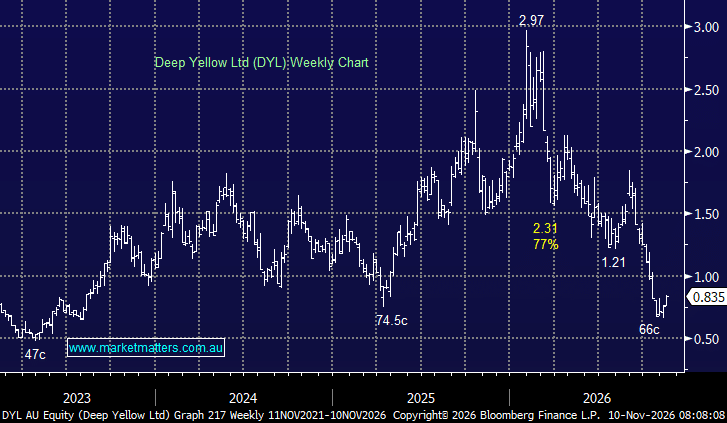
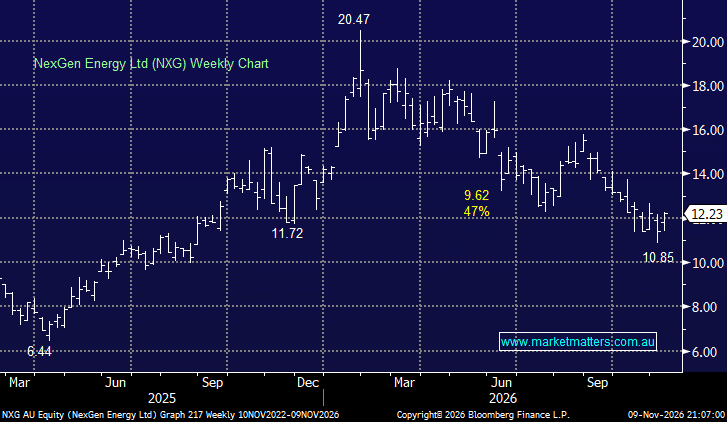
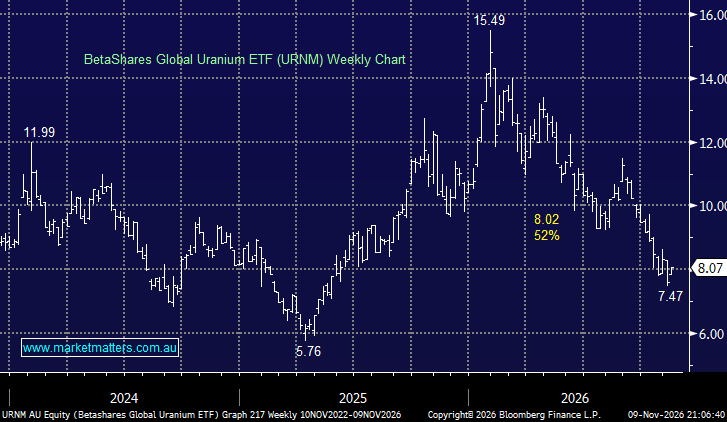
Another similar picture, IGO may be a very low-cost lithium producer benefiting from Greenbushes' exceptional ore grade, but it will still struggle if Li prices continue to slip lower.

20 minute delayed
Join Market Matters and get full access to all our Opinion + Action
Undervalued
Morningstar Quantitative Rating as of 6 NOV 2026.
Quantitative Equity Rating Methodology – view here
Five-star price 4.61 Fair value 5.48 One-star price 6.50
Morningstar Quantitative Rating as of 6 NOV 2026.
Morningstar Quantitative Rating as of 6 NOV 2026. The slider runs from the five-star price (4.61) to the one-star price (6.50).
| Ratios |
|---|
| Currency (Price/reporting): AUD/AUD |
| Exchange Rate: 1.0000 |
| Price - closing or last bid | 4.96 |
| Price - 12 month high | 10.05 |
| Price - 12 month low | 4.77 |
| Pricing date | 5 NOV 2026 |
| Volume - avg. trading volume for the last ten days | 6.04 |
| Market capitalization | 3,756.05 |
| 12 Month High price date | 1 JUN 2026 |
| 12 Month Low price date | 23 OCT 2026 |
| Volume - avg. trading volume for the last 3 months | 3.68 |
| Price - 1 Day % Change | -5.88% |
| Price - 13 week price percent change | -31.11% |
| Price - 26 week price percent change | -34.56% |
| Price - 5 Day % Change | -5.52% |
| Price - 52 week price percent change | -1.98% |
| Price - YTD price percent change | -39.51% |
| Price % Change Month To Date | -22.74% |
| EPS excluding extraordinary items - most recent fiscal year | 0.191 |
| EPS excluding extraordinary items - trailing 12 month | 0.191 |
| EPS Normalized - most recent fiscal year | 0.143 |
| Revenue/share - most recent fiscal year | 0.589 |
| Revenue/share - trailing 12 month | 0.589 |
| Book value per share - most recent fiscal year | 2.958 |
| Book value per share - most recent half-year | 2.958 |
| Book value (tangible) per share - most recent fiscal year | 2.958 |
| Book value (tangible) per share - most recent half-year | 2.958 |
| Cash per share - most recent fiscal year | 0.510 |
| Cash per share - most recent half-year | 0.510 |
| Cash Flow per share - most recent fiscal year | 0.174 |
| Cash Flow per share - trailing 12 month | 0.174 |
| Dividend per share - most recent fiscal year | — |
| Dividends per share - trailing 12 month | 0.050 |
| EBITD per share - trailing 12 month | 0.422 |
| EPS Basic excluding extraordinary items - most recent fiscal year | 0.192 |
| EPS Basic excluding extraordinary items - trailing 12 month | 0.192 |
| EPS including extraordinary items - most recent fiscal year | 0.192 |
| EPS including extraordinary items - trailing 12 month | 0.192 |
| Free Cash Flow per share - trailing 12 month | 0.166 |
| P/E excluding extraordinary items, most recent fiscal year | 26.04 |
| P/E Normalized, most recent fiscal year | 34.68 |
| Price to sales - most recent fiscal year | 8.43 |
| Price to Tangible Book - most fiscal year | 1.68 |
| Price to Free Cash Flow per Share - most recent fiscal year | 29.95 |
| Price to Cash Flow per share - trailing 12 month | 28.57 |
| Price to Book - most recent fiscal year | 1.68 |
| P/E excluding extraordinary items high, trailing 12 months | 45.62 |
| P/E excluding extraordinary items low, trailing 12 months | 25.04 |
| Net Debt, LFI | -390.00 |
| Net Debt, LFY | -468.80 |
| Dividend Yield - 5 Year Average | 1.70% |
| Dividend Yield - indicated annual dividend divided by closing price | 1.03% |
| Current Dividend Yield - Common Stock Primary Issue, LTM | 1.01% |
| Free Cash Flow - most recent fiscal year | 126.30 |
| LT debt/equity - most recent fiscal year | 0.07% |
| Payout ratio - most recent fiscal year | — |
| Total debt/total equity - most recent fiscal year | 0.75% |
| LT debt/equity - most recent half-year | 0.04% |
| Total debt/total equity - most recent half-year | 1.02% |
| Free Cash Flow - trailing 12 month | 126.30 |
| Payout ratio - trailing 12 month | — |
| Revenue - most recent fiscal year | 448.90 |
| Revenue - trailing 12 month | 448.90 |
| EBITD - most recent fiscal year | 322.20 |
| EBITD - trailing 12 month | 322.20 |
| Earnings before taxes - most recent fiscal year | 141.20 |
| Earnings before taxes - trailing 12 month | 141.20 |
| Net Income available to common - most recent fiscal year | 145.30 |
| Net Income available to common - trailing 12 months | 145.30 |
| Earnings before taxes Normalized - most recent fiscal year | 114.70 |
| Net Income Available to Common, Normalized - most recent fiscal year | 109.10 |
| Earnings per Share, Normalized, Excluding Extraordinary Items, Avg. Diluted Shares Outstanding, TTM | 0.14 |
| Net Profit Margin % - 1st historical fiscal year | 32.37% |
| Net Profit Margin % - trailing 12 month | 32.37% |
| Operating margin - 1st historical fiscal year | -23.95% |
| Operating margin - trailing 12 month | -23.95% |
| Pretax margin - trailing 12 month | 31.45% |
| Pretax margin - 1st historical fiscal year | 31.45% |
| Operating Margin - 5 year average | -38.83% |
| Pretax Margin - 5 year average | -12.92% |
| Free Operating Cash Flow/Revenue, 5 Year Average | 59.11% |
| Free Operating Cash Flow/Revenue, TTM | 28.14% |
| Net Profit Margin - 5 year average | -12.42% |
| Return on average assets - most recent fiscal year | 6.14% |
| Return on average assets - trailing 12 month | 6.14% |
| Return on average equity - most recent fiscal year | 6.82% |
| Return on average equity - trailing 12 month | 6.82% |
| Return on average assets - 5 year average | -2.06% |
| Return on average equity - 5 year average | -1.58% |
| Net Income/employee - most recent fiscal year | — |
| Revenue/employee - most recent fiscal year | — |
| Revenue growth rate, 5 year | -6.25% |
| EPS growth rate, 5 year | -25.04% |
| Growth rate% - dividend, 3 year | — |
| Revenue/share (5 yr growth) | -8.34% |
| Growth rate% - Revenue, 3 year | -24.66% |
| Growth rate% - EPS, 3 year | -35.88% |
| Book value per share growth rate, 5 year | -6.88% |
| Capital Spending growth rate, 5 year | -42.22% |
| Earnings Before Interest, Taxes, Depreciation & Amortization, 5 Year CAGR | -1.96% |
Financial forecast (AUD, millions except per share)
| Actuals | Estimates | |||||||
| 2026 | 2027 | 2028 | 2029 | |||||
| Estimate breakdown | ||||||||
Financials (AUD, millions)
| Period end: | JUN 22 | JUN 23 | JUN 24 | JUN 25 | JUN 26 |
| Fiscal year: | 2022 | 2023 | 2024 | 2025 | 2026 |
| Period length: | 12 months | 12 months | 12 months | 12 months | 12 months |
Announcements
| DATE | TIME | HEADING | PAGES |
| Price sensitive |
Another similar picture, IGO may be a very low-cost lithium producer benefiting from Greenbushes' exceptional ore grade, but it will still struggle if Li prices continue to slip lower.
Last week, IGO announced the sale of its Nova nickel operation in Western Australia to Global Lithium Resources (ASX: GL1) for just $7 million, comprising $3 million in cash, $2 million in GL1 shares and $2 million in deferred cash. The sale marks IGO's latest exit from nickel, following the divestment of its Forrestania operations, as CEO Ivan Vella continues to reposition the company towards lithium and copper through exploration and partnerships rather than acquisitions.
Nickel/lithium miner IGO was in the news yesterday following a fire at its Greenbushes lithium plant, although the company has since said production remains on track to meet FY26 guidance. Over the past year, IGO has been a classic “world-class asset, execution headache” story, which is unfortunately not an isolated theme across the ASX mining sector.
Nickel/lithium miner IGO reported an “ok” result last week, but its still losing money – covered Here. Again the stock looks interesting after retracing 18%, largely following the lithium price lower, while it’s not our top pick, further strength would not be a surprise.
IGO –5.1%: Still losing money although underlying EBITDA returned to the black. Balance sheet is good but hard to get too excited over this one.
IGO has endured a shocking few years after paying a crazy price for the nickel business Western Areas (WSA) in 2021, only to watch prices collapse.
IGO tumbled 14% on Wednesday following the CATL news, one of four stocks to end the day down 14% or more. The company delivered a disappointing 4Q result, including weak lithium production and softer cash flow.
Last month’s 4Q results were mixed, with strong performance from Nova Nickel project more than offset by weaker lithium production and softer cash flow. Disappointingly FY26 guidance points to a slower ramp-up at Greenbushes and elevated costs at Nova with the weaker-than-expected production guidance reflecting delays and ongoing ramp-up issues.
IGO -7.2%: 4Q results were mixed, with strong performance from Nova Nickel project more than offset by weaker lithium spodumene Greenbushes production and softer cash flow.
Yesterday saw IGO endure a sharp -6.7% pullback as lithium related names came under the hammer. However, IGO is a low-cost currently profitable producer which will benefit from further strength in lithium prices with a far higher degree of certainty than some of its peers.
MM is neutral towards IGO around $7.00
MM is cautiously bullish towards IGO around $6.50
MM is neutral towards IGO around $8.40
MM is neutral towards IGO around $8
MM is neutral IGO ~8.00
MM is cautiously bullish towards IGO
MM remains neutral towards IGO
MM remains neutral towards IGO
MM has turned neutral toward IGO
MM is cautiously bullish towards IGO ~$4.75

IGO is a mining and exploration company based in Western Australia. Its primary asset is a minority stake in the Greenbushes lithium mine through a joint venture with Tianqi Lithium and Albemarle. Greenbushes is the world's lowest-cost hard rock lithium resource. IGO also has an interest in downstream processing through a 49% stake in the Kwinana lithium hydroxide refinery. Outside of lithium, IGO owns and operates the Nova nickel-copper-cobalt mine, which has a short remaining life.






Forgot password? Request a One Time Password or reset your password
One Time Password
Check your email for an email from [email protected]
Subject: Your OTP for Account Access
This email will have a code you can use as your One Time Password for instant access
A link to create a new password will be sent to the email address you have registered to your account.

Hi, this is only available to members. Join today and access the latest views on the latest developments from a professional money manager.

Our Smart Phone App will give you access to much of our content and notifications. Download for free today.
Hi, this is only available to members. Join today and access the latest views on the latest developments from a professional money manager.
JOIN NOW
Something went wrong. Please try again in a moment.