Flagship Growth Portfolio – Amendments
We are selling two holdings in the Flagship Growth Portfolio to increase cash into prevailing strength

20 minute delayed
Join Market Matters and get full access to all our Opinion + Action
Undervalued
Morningstar Quantitative Rating as of 6 NOV 2026.
Quantitative Equity Rating Methodology – view here
Five-star price 1.46 Fair value 1.70 One-star price 1.98
Morningstar Quantitative Rating as of 6 NOV 2026.
Morningstar Quantitative Rating as of 6 NOV 2026. The slider runs from the five-star price (1.46) to the one-star price (1.98).
| Ratios |
|---|
| Currency (Price/reporting): AUD/AUD |
| Exchange Rate: 1.0000 |
| Price - closing or last bid | 1.29 |
| Price - 12 month high | 1.46 |
| Price - 12 month low | 0.91 |
| Pricing date | 5 NOV 2026 |
| Volume - avg. trading volume for the last ten days | 0.58 |
| Market capitalization | 666.17 |
| 12 Month High price date | 19 FEB 2026 |
| 12 Month Low price date | 18 JUN 2026 |
| Volume - avg. trading volume for the last 3 months | 0.68 |
| Price - 1 Day % Change | -1.53% |
| Price - 13 week price percent change | 31.63% |
| Price - 26 week price percent change | 21.13% |
| Price - 5 Day % Change | -0.77% |
| Price - 52 week price percent change | 11.21% |
| Price - YTD price percent change | 4.45% |
| Price % Change Month To Date | 5.74% |
| EPS excluding extraordinary items - most recent fiscal year | 0.148 |
| EPS excluding extraordinary items - trailing 12 month | 0.148 |
| EPS Normalized - most recent fiscal year | 0.172 |
| Revenue/share - most recent fiscal year | 1.529 |
| Revenue/share - trailing 12 month | 1.529 |
| Book value per share - most recent fiscal year | 1.528 |
| Book value per share - most recent half-year | 1.528 |
| Book value (tangible) per share - most recent fiscal year | 1.513 |
| Book value (tangible) per share - most recent half-year | 1.513 |
| Cash per share - most recent fiscal year | 0.242 |
| Cash per share - most recent half-year | 0.242 |
| Cash Flow per share - most recent fiscal year | 0.514 |
| Cash Flow per share - trailing 12 month | 0.514 |
| Dividend per share - most recent fiscal year | — |
| Dividends per share - trailing 12 month | 0.000 |
| EBITD per share - trailing 12 month | 0.531 |
| EPS Basic excluding extraordinary items - most recent fiscal year | 0.148 |
| EPS Basic excluding extraordinary items - trailing 12 month | 0.148 |
| EPS including extraordinary items - most recent fiscal year | 0.148 |
| EPS including extraordinary items - trailing 12 month | 0.148 |
| Free Cash Flow per share - trailing 12 month | 0.151 |
| P/E excluding extraordinary items, most recent fiscal year | 8.72 |
| P/E Normalized, most recent fiscal year | 7.51 |
| Price to sales - most recent fiscal year | 0.84 |
| Price to Tangible Book - most fiscal year | 0.85 |
| Price to Free Cash Flow per Share - most recent fiscal year | 8.57 |
| Price to Cash Flow per share - trailing 12 month | 2.51 |
| Price to Book - most recent fiscal year | 0.84 |
| P/E excluding extraordinary items high, trailing 12 months | 10.25 |
| P/E excluding extraordinary items low, trailing 12 months | 6.29 |
| Net Debt, LFI | 143.34 |
| Net Debt, LFY | 127.05 |
| Dividend Yield - 5 Year Average | — |
| Dividend Yield - indicated annual dividend divided by closing price | — |
| Current Dividend Yield - Common Stock Primary Issue, LTM | 0.00% |
| Free Cash Flow - most recent fiscal year | 78.02 |
| LT debt/equity - most recent fiscal year | 28.37% |
| Payout ratio - most recent fiscal year | — |
| Total debt/total equity - most recent fiscal year | 31.86% |
| LT debt/equity - most recent half-year | 5.85% |
| Total debt/total equity - most recent half-year | 41.63% |
| Free Cash Flow - trailing 12 month | 78.02 |
| Payout ratio - trailing 12 month | — |
| Revenue - most recent fiscal year | 792.84 |
| Revenue - trailing 12 month | 792.84 |
| EBITD - most recent fiscal year | 275.24 |
| EBITD - trailing 12 month | 275.24 |
| Earnings before taxes - most recent fiscal year | 109.33 |
| Earnings before taxes - trailing 12 month | 109.33 |
| Net Income available to common - most recent fiscal year | 76.66 |
| Net Income available to common - trailing 12 months | 76.66 |
| Earnings before taxes Normalized - most recent fiscal year | 114.23 |
| Net Income Available to Common, Normalized - most recent fiscal year | 89.02 |
| Earnings per Share, Normalized, Excluding Extraordinary Items, Avg. Diluted Shares Outstanding, TTM | 0.17 |
| Net Profit Margin % - 1st historical fiscal year | 9.67% |
| Net Profit Margin % - trailing 12 month | 9.67% |
| Operating margin - 1st historical fiscal year | 16.19% |
| Operating margin - trailing 12 month | 16.19% |
| Pretax margin - trailing 12 month | 13.79% |
| Pretax margin - 1st historical fiscal year | 13.79% |
| Operating Margin - 5 year average | 14.81% |
| Pretax Margin - 5 year average | 10.92% |
| Free Operating Cash Flow/Revenue, 5 Year Average | 6.65% |
| Free Operating Cash Flow/Revenue, TTM | 9.84% |
| Net Profit Margin - 5 year average | 7.79% |
| Return on average assets - most recent fiscal year | 5.94% |
| Return on average assets - trailing 12 month | 5.94% |
| Return on average equity - most recent fiscal year | 10.16% |
| Return on average equity - trailing 12 month | 10.16% |
| Return on average assets - 5 year average | 5.34% |
| Return on average equity - 5 year average | 9.63% |
| Net Income/employee - most recent fiscal year | — |
| Revenue/employee - most recent fiscal year | — |
| Revenue growth rate, 5 year | 5.02% |
| EPS growth rate, 5 year | 30.15% |
| Growth rate% - dividend, 3 year | — |
| Revenue/share (5 yr growth) | 5.19% |
| Growth rate% - Revenue, 3 year | -3.23% |
| Growth rate% - EPS, 3 year | 23.51% |
| Book value per share growth rate, 5 year | 9.20% |
| Capital Spending growth rate, 5 year | 4.12% |
| Earnings Before Interest, Taxes, Depreciation & Amortization, 5 Year CAGR | 3.12% |
Financial forecast (AUD, millions except per share)
| Actuals | Estimates | |||||||
| 2026 | 2027 | 2028 | 2029 | |||||
| Estimate breakdown | ||||||||
Financials (AUD, millions)
| Period end: | JUN 22 | JUN 23 | JUN 24 | JUN 25 | JUN 26 |
| Fiscal year: | 2022 | 2023 | 2024 | 2025 | 2026 |
| Period length: | 12 months | 12 months | 12 months | 12 months | 12 months |
Announcements
| DATE | TIME | HEADING | PAGES |
| Price sensitive |
We are selling two holdings in the Flagship Growth Portfolio to increase cash into prevailing strength
Most portfolios have a “dog” lurking in their midst and ours undoubtedly is mining equipment rental business EHL which although it’s doubled over the last year has failed to regain the vast majority of it’s COVID losses.
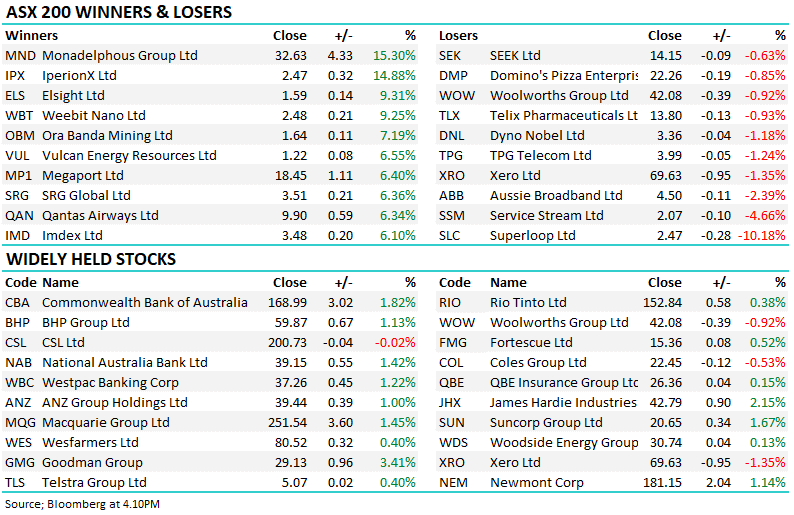
Emeco Holdings (EHL) -8.06%: gave back yesterday’s for similar reasons to Boral today. The stock ran yesterday on a solid result from peer Imdex (IMD) but Emeco didn’t really live up to the hype today despite posting half year numbers more or less in line with the street.
Emeco (EHL) +8.05%: Another beaten up cyclical that was out with a more positive update this morning, although from MM’s perspective it was simply a reiteration of guidance and a reinforcement of the path the company has been on over the past year. As they suggested today, the balance sheet is now the best its been since listing in 2006 and the trends on the earnings side are positive overall, although a bit lumpy. Weakness in coal prices hurt, however this is being offset by strength in Gold. All up, a decent update that was taken more as a relief by the market which seemed to think they would miss their stated EBITDA guidance of $115-118m for the half to Dec (consensus was $114m)
MM are selling EHL in the Flagship Growth Portfolio, taking loss & increasing cash around 95c
MM is considering cutting our loss on EHL around 95c
A beaten up cyclical on the improve – we are patient holders for now
MM is bullish EHL below $1.00
MM remains bullish equities medium-term

Emeco Holdings Ltd is engaged in the provision of surface and underground mining equipment rental and complementary equipment and workshop and field services, including maintenance, asset and component rebuilds, fleet optimisation technology, and technical and engineering services. Its segments are Rental provides a wide range of surface and underground earthmoving equipment solutions to customers in Australia. Additional technology platforms have been developed to enable customers to improve earthmoving efficiencies of their rental machines; and Workshops provides maintenance, equipment and component rebuild services to customers in Australia. Majority of revenue comes from Rental segment.






Forgot password? Request a One Time Password or reset your password
One Time Password
Check your email for an email from [email protected]
Subject: Your OTP for Account Access
This email will have a code you can use as your One Time Password for instant access
A link to create a new password will be sent to the email address you have registered to your account.

Hi, this is only available to members. Join today and access the latest views on the latest developments from a professional money manager.

Our Smart Phone App will give you access to much of our content and notifications. Download for free today.
Hi, this is only available to members. Join today and access the latest views on the latest developments from a professional money manager.
JOIN NOW
Something went wrong. Please try again in a moment.