Emerging Companies Portfolio – Amendments
We are making several changes to the Emerging Companies Portfolio.

20 minute delayed
Join Market Matters and get full access to all our Opinion + Action
Undervalued
Morningstar Quantitative Rating as of 9 NOV 2026.
Quantitative Equity Rating Methodology – view here
Five-star price 3.54 Fair value 3.87 One-star price 4.23
Morningstar Quantitative Rating as of 9 NOV 2026.
Morningstar Quantitative Rating as of 9 NOV 2026. The slider runs from the five-star price (3.54) to the one-star price (4.23).
| Ratios |
|---|
| Currency (Price/reporting): AUD/AUD |
| Exchange Rate: 1.0000 |
| Price - closing or last bid | 3.67 |
| Price - 12 month high | 4.11 |
| Price - 12 month low | 3.40 |
| Pricing date | 9 NOV 2026 |
| Volume - avg. trading volume for the last ten days | 0.94 |
| Market capitalization | 2,882.59 |
| 12 Month High price date | 23 DEC 2025 |
| 12 Month Low price date | 5 OCT 2026 |
| Volume - avg. trading volume for the last 3 months | 1.09 |
| Price - 1 Day % Change | 0.00% |
| Price - 13 week price percent change | -6.14% |
| Price - 26 week price percent change | -4.92% |
| Price - 5 Day % Change | 2.23% |
| Price - 52 week price percent change | -4.36% |
| Price - YTD price percent change | -6.54% |
| Price % Change Month To Date | 2.23% |
| EPS excluding extraordinary items - most recent fiscal year | 0.559 |
| EPS excluding extraordinary items - trailing 12 month | 0.559 |
| EPS Normalized - most recent fiscal year | 0.189 |
| Revenue/share - most recent fiscal year | 0.284 |
| Revenue/share - trailing 12 month | 0.284 |
| Book value per share - most recent fiscal year | 4.283 |
| Book value per share - most recent half-year | 4.283 |
| Book value (tangible) per share - most recent fiscal year | 4.112 |
| Book value (tangible) per share - most recent half-year | 4.112 |
| Cash per share - most recent fiscal year | 0.149 |
| Cash per share - most recent half-year | 0.149 |
| Cash Flow per share - most recent fiscal year | 0.184 |
| Cash Flow per share - trailing 12 month | 0.184 |
| Dividend per share - most recent fiscal year | — |
| Dividends per share - trailing 12 month | 0.194 |
| EBITD per share - trailing 12 month | 0.616 |
| EPS Basic excluding extraordinary items - most recent fiscal year | 0.559 |
| EPS Basic excluding extraordinary items - trailing 12 month | 0.559 |
| EPS including extraordinary items - most recent fiscal year | 0.559 |
| EPS including extraordinary items - trailing 12 month | 0.559 |
| Free Cash Flow per share - trailing 12 month | 0.184 |
| P/E excluding extraordinary items, most recent fiscal year | 6.56 |
| P/E Normalized, most recent fiscal year | 19.41 |
| Price to sales - most recent fiscal year | 12.93 |
| Price to Tangible Book - most fiscal year | 0.89 |
| Price to Free Cash Flow per Share - most recent fiscal year | 19.92 |
| Price to Cash Flow per share - trailing 12 month | 19.92 |
| Price to Book - most recent fiscal year | 0.86 |
| P/E excluding extraordinary items high, trailing 12 months | 11.02 |
| P/E excluding extraordinary items low, trailing 12 months | 6.13 |
| Net Debt, LFI | 926.07 |
| Net Debt, LFY | 641.35 |
| Dividend Yield - 5 Year Average | 4.96% |
| Dividend Yield - indicated annual dividend divided by closing price | 5.25% |
| Current Dividend Yield - Common Stock Primary Issue, LTM | 5.28% |
| Free Cash Flow - most recent fiscal year | 134.50 |
| LT debt/equity - most recent fiscal year | 22.56% |
| Payout ratio - most recent fiscal year | — |
| Total debt/total equity - most recent fiscal year | 22.56% |
| LT debt/equity - most recent half-year | 27.37% |
| Total debt/total equity - most recent half-year | 32.37% |
| Free Cash Flow - trailing 12 month | 134.50 |
| Payout ratio - trailing 12 month | — |
| Revenue - most recent fiscal year | 207.30 |
| Revenue - trailing 12 month | 207.30 |
| EBITD - most recent fiscal year | 449.52 |
| EBITD - trailing 12 month | 449.52 |
| Earnings before taxes - most recent fiscal year | 408.80 |
| Earnings before taxes - trailing 12 month | 408.80 |
| Net Income available to common - most recent fiscal year | 408.40 |
| Net Income available to common - trailing 12 months | 408.40 |
| Earnings before taxes Normalized - most recent fiscal year | 138.21 |
| Net Income Available to Common, Normalized - most recent fiscal year | — |
| Earnings per Share, Normalized, Excluding Extraordinary Items, Avg. Diluted Shares Outstanding, TTM | 0.19 |
| Net Profit Margin % - 1st historical fiscal year | 197.01% |
| Net Profit Margin % - trailing 12 month | 197.01% |
| Operating margin - 1st historical fiscal year | 87.45% |
| Operating margin - trailing 12 month | 87.45% |
| Pretax margin - trailing 12 month | 197.20% |
| Pretax margin - 1st historical fiscal year | 197.20% |
| Operating Margin - 5 year average | 83.82% |
| Pretax Margin - 5 year average | 154.56% |
| Free Operating Cash Flow/Revenue, 5 Year Average | 70.76% |
| Free Operating Cash Flow/Revenue, TTM | 64.88% |
| Net Profit Margin - 5 year average | 154.52% |
| Return on average assets - most recent fiscal year | 10.14% |
| Return on average assets - trailing 12 month | 10.14% |
| Return on average equity - most recent fiscal year | 13.27% |
| Return on average equity - trailing 12 month | 13.27% |
| Return on average assets - 5 year average | 8.22% |
| Return on average equity - 5 year average | 10.35% |
| Net Income/employee - most recent fiscal year | — |
| Revenue/employee - most recent fiscal year | — |
| Revenue growth rate, 5 year | 6.37% |
| EPS growth rate, 5 year | 6.49% |
| Growth rate% - dividend, 3 year | 2.06% |
| Revenue/share (5 yr growth) | 3.75% |
| Growth rate% - Revenue, 3 year | 9.49% |
| Growth rate% - EPS, 3 year | 114.20% |
| Book value per share growth rate, 5 year | 5.46% |
| Capital Spending growth rate, 5 year | — |
| Earnings Before Interest, Taxes, Depreciation & Amortization, 5 Year CAGR | 10.08% |
Financial forecast (AUD, millions except per share)
| Actuals | Estimates | |||||||
| 2026 | 2027 | 2028 | ||||||
| Estimate breakdown | ||||||||
Financials (AUD, millions)
| Period end: | JUN 22 | JUN 23 | JUN 24 | JUN 25 | JUN 26 |
| Fiscal year: | 2022 | 2023 | 2024 | 2025 | 2026 |
| Period length: | 12 months | 12 months | 12 months | 12 months | 12 months |
Announcements
| DATE | TIME | HEADING | PAGES |
| Price sensitive |
We are making several changes to the Emerging Companies Portfolio.
BWP +4.86%: A good/solid result from the predominately Bunnings Warehouse landlord, with rental growth feeding into higher distributions for this defensive REIT, that has been unloved;
A well-run REIT, conservatively managed now with some growth upside from the NPR acquisition.
The Bunnings landlord has been on the radar for the Emerging Companies Portfolio since January when we took a closer look at their takeover of retail landlord Newmark Property (NPR) covered here. Ultimately, we have held off adding BWP to the portfolio, preferring to hold Centuria Capital (CNI) for property exposure while the deal played out. NPR shares were suspended yesterday on compulsory acquisition grounds, given more than 90% of shares were now controlled by BWP.
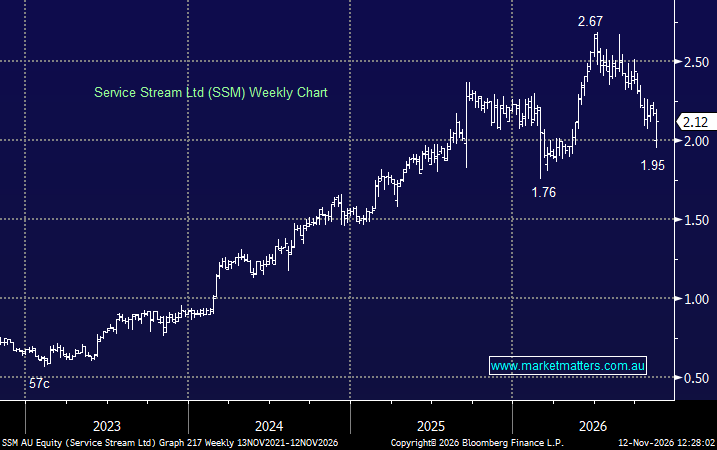
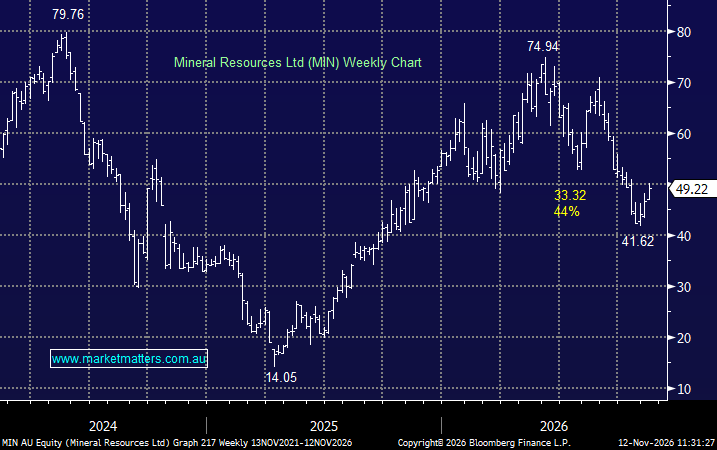
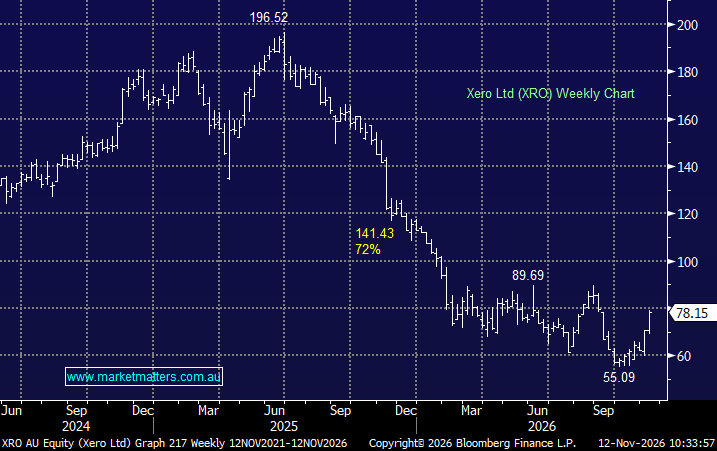
We are making a number of changes to the Emerging Companies Portfolio. Selling FCL & GL1, trimming SLX, SFR, CNI & SRG, buying LTR & BWP, and adding to AD8 & C79.
BWP has a portfolio of 65 core properties, which, for the most part, are leased to Bunnings Warehouse. The $2.6b company has low gearing, highly favourable lease agreements with long-term tenants, and low gearing of just ~16%. They are expected to pay ~5.5% yield over the next 12 months, while we are also seeing some opportunities to grow earnings from here.
BWP -3.27%: The Bunnings landlord (85% of book leased to Wesfarmers) edged lower today in a soft market despite reporting FY23 results that were inline with expectations.
BWP -2.20%: The property trust was out with their full year result today and it was very much business as usual. Attributable profit was inline at $117.5m (v$116m exp), dividend of 18.3c inline, gearing low at 17.7%, property values up marginally however it continues to trade at a ~25% premium to the value of its assets (NTA of $3.29).
MM are selling BWP in the Emerging Companies Portfolio, taking a small loss around $3.45
MM is bullish BWP following todays update
MM is bullish & long BWP
MM are buying BWP Trust (BWP) in the Emerging Companies Portfolio, targeting a 4% weighting around $3.68
MM is bullish BWP
MM is interested in BWP from a defensive mid-cap perspective
MM is neutral BWP, although below $3.50 starts to get interesting
MM is neutral BWP at best

BWP Group is an Australian REIT focused on owning warehouse or bulky goods retailing properties with relatively large sites and high visibility and access to arterial roads. The portfolio of properties it owns is diversified across most Australian states and is on long-term leases to Australia's dominant home improvement chain: Bunnings Group. Bunnings is a wholly owned subsidiary of Wesfarmers, a top-10 ASX-listed company by market capitalization. Wesfarmers owns 23% of BWP.







Forgot password? Request a One Time Password or reset your password
One Time Password
Check your email for an email from [email protected]
Subject: Your OTP for Account Access
This email will have a code you can use as your One Time Password for instant access
A link to create a new password will be sent to the email address you have registered to your account.

Hi, this is only available to members. Join today and access the latest views on the latest developments from a professional money manager.

Our Smart Phone App will give you access to much of our content and notifications. Download for free today.
Hi, this is only available to members. Join today and access the latest views on the latest developments from a professional money manager.
JOIN NOW
Something went wrong. Please try again in a moment.