Hi David,
- US Federal Debt: around $38 trillion, yes.
- Interest bill: roughly $1.2 trillion p.a., now the largest single line item in the US budget — exceeding defence and Medicare.
- Debt servicing has exploded because average borrowing costs rose from ~1.5% a few years ago to over 4.5% today.
That means the US is effectively rolling over trillions of low-rate debt into much higher rates, compounding the fiscal pressure each year.
Trump’s claim that tariffs “pay down the debt” is political spin.
- Tariff receipts (~$200 billion currently, even if quadrupled to $1 trillion) are tiny relative to the debt interest.
- Moreover, tariffs are effectively a tax on US consumers and importers — they don’t create new productive capacity, and they often lift domestic prices.
So, even at his most optimistic assumptions, tariff revenue would barely offset interest costs, not reduce principal.
The likely outcomes of this mix (high debt, higher rates, fiscal expansion) are:
- Higher-for-longer inflation — particularly in services and wages.
- Weaker US dollar over time as investors demand higher yields for holding US debt.
- Crowding out of private investment, as the Treasury soaks up capital.
Eventual recession risk — not necessarily immediate, but fiscal fatigue and higher rates tend to bite with a lag.
The current US fiscal trajectory is unsustainable without either:
- a material increase in growth and productivity,
- or a meaningful fiscal tightening (spending cuts, entitlement reform, or higher taxes).
Absent that, the US is effectively betting on financial repression — keeping nominal GDP growth (via inflation) above real interest costs — to slowly erode the debt load.
That’s not catastrophic today, and there are no signs yet that the world does not want to fund this path, though, there is a high chance that it will ultimately lead to recession, inflation, or both, at some point – we just don’t know when.
While we don’t want to sound flippant about this, and we share the concern, we can only be guided by the data, and whether or not we’re seeing ‘stress’ in the system. That’s not the case for now, but it may change. Not investing we think has greater long term financial implications relative to the alternative.
If we only had to watch one thing as a guide to all of this, it is the US bond market. Any sign the US is having issues selling debt, will likely be the canary in the coal mine.
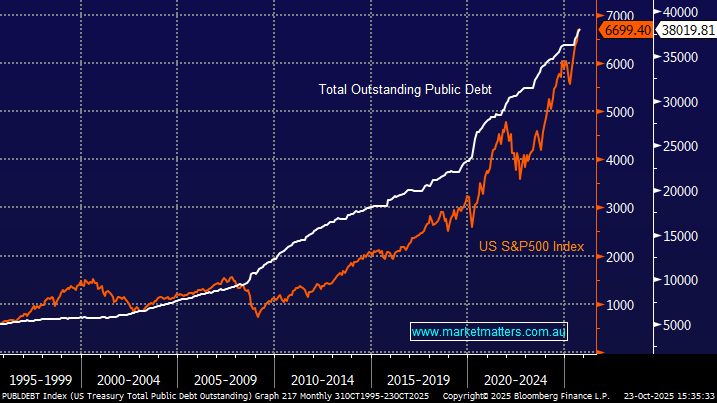
Worth noting that US Debt has been climbing for decades and although President Trump might not rein in this runaway train it left the station well before his first, or second, election victory. In fact, rising government debt is usually good for stocks because it injects liquidity into the system.
- The S&P 500 often accelerates higher as more money pumps money into the economy (increases debt) as can be seen on the chart below.
We look at the traditional M2 Money Supply number to get a read on the total amount of money circulating in the economy — it captures both cash and easily accessible forms of money. When combined with the unconventional path of speculative assets like Bitcoin it gives us a handle on the available funds to push equities higher, or not.
- There are no liquidity/debt flags waving yet but like everything conditions must be monitored closely.