Hi Peter,
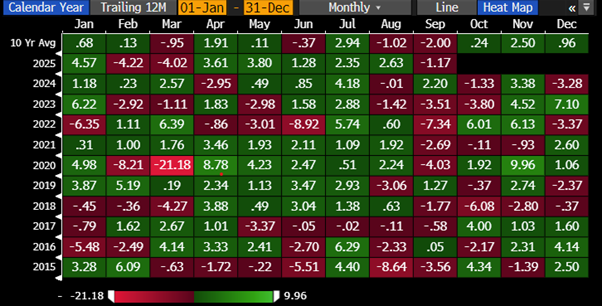
The numbers we quote for the ASX don’t include dividends, but September also has a very compelling negative bias for the US S&P 500 where dividends/yield are far less relevant:
- Since 1950, the index has declined by an average of –0.6% in September ranking it the weakest month on average.
- Also, since 1950, only about 44% of Septembers have ended with positive returns for the S&P 500 – the lowest positivity rate of any month.
- Over the last decade, the average September return has leaned slightly worse, at around –2.0%.
MM doesn’t let seasonality dictate our portfolio positioning, but we are conscious of it, especially when we are looking to move up/down the risk curve. i.e. with September being a seasonally weak month, we can often adopt a patient stance towards buying but thats about the extent of it.