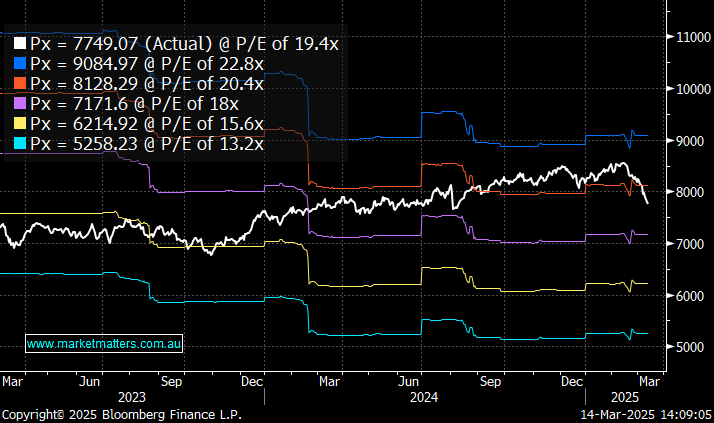
PE calculation of index
Hi guys, Thanks again for all the work which goes into the reports and q&a's. (and for the patience with another index question) I actually have a suggestion and a question: - I know know working out pe for an index is a lot more challenging than just a single company, but is there a way or a listing where I can work this out to a price? I know for example that the ASX200 is about ~20x currently with an expected growth of ~4%. What I could not do though was work out at what price it starts to fall back to 14-15x. I'm sure there should be a simple formula and figures I can find somewhere. I think I just started to confuse myself when I was calculating it earlier in the week. - The suggestion, is related to when companies drop after the dividend. Sometimes you list these as just the $drop for the day or %drop, sometimes you list both. For example on Thursday "Yancoal (YAL) -12.56% traded ex-dividend for 53cps fully franked, equivalent to 75c (stock fell 76c)." This is great as it's easy to see impact the dividend was compared to the drop. Compared to one last week, "Super Retail (SUL) -3.34% traded ex-dividend for 32cps fully franked." Without looking up SUL price, I don't know what a 3.34% drop would be $wise. I get that if I was holding shares I'd be aware of the price, but while reading, it's only half the info. Would you be able to say, as an example. 5% drop (down $1), dividend of $0.95. It's now easy to see that the drop was just the dividend without needing to look it up. Thanks guys, have a good weekend. Regards, Simon