The Hickman Report – Saturday 26th July 2014
Market Matters Summary for Saturday 26th July 2014
- The ASX200 closed up 52 points (0.9%) last week, following the Hang Seng up 762 points (3.2%) and Canadian S&P/TSX Composite Index up 189 points (1.2%), to all time highs, but noticeably ignoring the traditional US & Europe heavyweights where the Dow was down 140 points (0.8%) and the German DAX 76 points (0.8%).
- My prediction of corrections in the Russell 2000 (US small caps) and German DAX indices are unfolding exactly as anticipated BUT this is not leading to any domestic correction. With so much “free money” swimming around, courtesy of Central Banks, Fund Managers appear to be switching between Indices rather than selling.
- It now appears we need to be a “stock picker” and an “Index picker”, with the US appearing set to underperform.
- The very influential Goldman Sachs has just stated they believe global stocks are at risk of a brief sell off (3 months) – a slight worry as this is my view and generally markets do not unfold as everyone predicts.
- Like me, it’s a combination of rising interest rates and stretched valuations that concern them. The S&P500 is trading at 18 times earnings, close to the highest level since March 2010 and 14% above its 5 year average.
- So while I believe both fundamentally (valuations) and technically equities are due an 8-10% correction we cannot “fight the tape” and I am now feeling the ASX200 may continue this rare period of outperformance.
- The two markets (DAX / Russell 2000) I remain the most bearish have been falling for the last few weeks, if the heavyweight S&P500 follows it remains hard to see the ASX200 accelerating clear of the 5500-5600 area.
- Last week clearly the buyers at lower levels became impatient and started chasing / paying up. It will be very interesting to see of this is maintained e.g. CBA technically looks set to test $83 (+0.9%).
- Even while the local market has been tough for many months some individual stocks are showing opportunities so focusing on individual stocks appears the smartest path at present.
- I also reiterate again that I will be an aggressive buyer of equities if a decent correction eventuates.
What Mattered Last Week
Last week was positive for the ASX200, it feels like the market is closing well every day as $$ flow into the local market. The best trade for the “day traders” has been to buy early when the market opens lower courtesy of overnight +100 point falls in the Dow, will it repeat on Monday?
On the performance front, the below stocks caught my eye over the last 5 trading days:
- Positive Performance – Bank of Queensland (BOQ) +2.1%, Caltex (CTX) +5.4%, Crown (CWN) +3.8%, Challenger (CGF) +4.2%, IAG Insurance (IAG) +5.9%, Leighton’s (LEI) +8.1%, Metcash (MTS) +1.*%.
- Negative Performance – Coca-Cola (CCL) -1.6%, CSL -1.2%, Macquarie Group (MQG) -2.3%, Myer -3%, Newcrest (NCM) -7.2%, Origin -0.8%.
- I am holding ~20% in cash, with equal weighting in Ansell (ANN), Challenger (CGF), M2 Group (MTU), & Seven West Media (SWM). Also note from my positions I am net negative the overall index via XJO and Westpac options.
- A few stocks continue to “twitch” my radar for buying/ accumulation into weakness.
What Matters this week
- Technically I remain neutral at present but remaining wary of an 8-10% retracement in the US that would enable me to buy aggressively a market I am bullish for next few years. A close under 5540 this week in the ASX200 would switch me negative the local market short term.
- Please note most trading and investing opportunities happen in under 5% of the time, in other words 3 weeks of the year, so patience / planning is vital. However, in the current choppy market I am likely to be more “stock specific active” than over recent years. Any questions please do not hesitate to contact us.
- Watch for specific ideas in morning reports and Alerts when I transact.
Potential Investing opportunities for the coming week
- My “trading” stops on Ansell (ANN) remain under $18.50, Challenger (CGF) under $7.40, M2 Communications (MTU) remains below $5.70 & Seven West Media (SWM) under $1.84.
- I can buy Seek (SEK) around $15.50 with stops under $13.50.
- I can buy Bank of Queensland (BOQ) around $11.30 with stops under $10.50.
- I can buy Fairfax (FXJ) under 85c with stops under 67c.
- I can buy Flight Centre (FLT) around $41- 42 with stops initially under $38.
- I can buy Resmed (RMD) around $4.40 with stops under $4.
Potential Trading for the coming week
- After last week’s strength in the domestic market I want to again sit on the sidelines for a few days but my “gut feel” is we will see a fresh high over 5600 early next week to tie in with CBA testing $83 prior to a pullback.
A list of some sleepers are below, some have already started to show signs of life, we will look to continually add to this list over any weakness:
- AWC, CSE, CSS, DCC, FXJ, KCN, KDL, LEI, & PEN. – I own the ones underlined, having bought DCC last week. See today’s story on the stock below, they must have read the Market Matters Morning Report.
http://www.afr.com/p/business/companies/getting_rich_one_bitcoin_at_time_IJu4wWCnQP5JqDuX0agKNN
Market Matters’ View at a glance
The below views are illustrated in detail by the charts beneath.
Bullish: ANN (m), CBA (d) & (m), CSL (m), Dow (m), Fairfax (m), IBEX (m), MTU (m), NASDAQ (m), Nikkei (m), OZL (m), RMD (w), SEK (m), S&P (m), SWM (m) & Vocus (w).
Neutral: AMP (w), ASX200 (d), Australian Banks (w), CWN (m), FMG (w), FTSE (w), Gold (w), Hang Seng (w), IBEX (w), Magellan (MFG) (w), NZ (m), REA (m), Retail Index (w), RIO (w), S&P (w), STOXX (w), SUN (w), TLS (m), WOW (m) & WPL (m).
Bearish: BOQ (d), BHP (m), China (m), Copper (m), Dax (w), NASDAQ (w), NCM (w), NZ (w), QBE (w) & WES (w).
- Time Frames – (d) = daily, (w) = weekly and (m) = monthly.
e.g. A (d) implies I am bullish on a daily basis but a (m) would mean I am bearish on a monthly / longer term basis.
Australian ASX200
I remain mildly bullish on a longer term basis, I will aggressively buy any decent pullback.
Chart 1 – ASX200 Monthly Chart

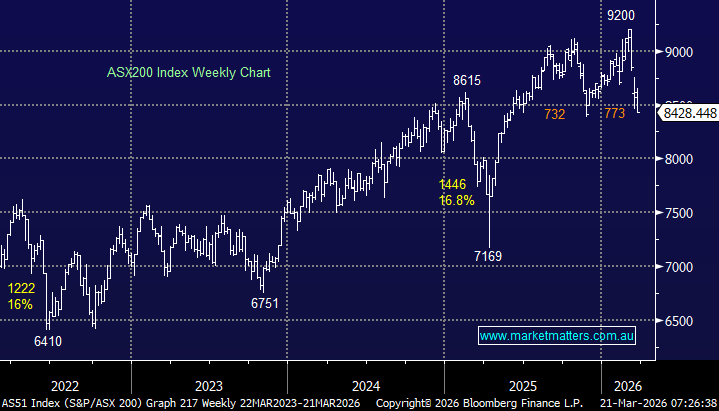
Chart 2 – ASX200 Weekly Chart

Chart 3 – ASX200 Daily Chart

Chart 4 – SPI (Share Price Index) Futures 60 mins Chart

Chart 5 – Volatility Index VIX Weekly Chart

Chart 6 – The US 10 year Interest Rate Monthly Chart

Chart 7 – New Zealand 50 Index Monthly Chart

American Equities
The American indices reached my sell levels in early March, the NASDAQ then proceeded to fall 8.7%. I now expect another 8-10% fall from the 3990 region that should commence soon, the Russell 2000 reached fresh 2014 highs recently and has already started falling (-5.1%).
Chart 8 – Dow Jones Index Monthly Chart

Chart 9 – Dow Jones Index Daily Chart

Chart 10 – S&P 500 Monthly Chart

Chart 11 – S&P 500 Weekly Chart

Chart 12 – Russell 2000 Index Monthly Chart

Chart 13 – NASDAQ Weekly Chart

Chart 14 – Canadian S&P/TSX Composite Index Monthly Chart

European Indices
The DAX now looks bearish and similar to the Russell 2000 / NASDAQ, with failure into current fresh highs my expectation.
Chart 15 – Euro Stoxx 50 Weekly Chart

Chart 16 – FTSE Weekly Chart

Chart 17 – Spanish IBEX Monthly Chart

Chart 18 – Spanish IBEX Weekly Chart

Chart 19 – German Dax Monthly Chart

Asian Indices
Asian indices remain positive, led by the Hang Seng. The Nikkei continues to be volatile and is now threatening a decent correction.
The China Index remains bearish long term with another +18% downside.
Chart 20 – Hang Seng Weekly Chart

Chart 21 – China Shanghai Composite Monthly Chart

Chart 22 – Japanese Nikkei 225 Monthly Chart

Australian Stocks
Buying sustainable yield and selling XJO calls has been a logical strategy over recent years. However, the risk of rising bond yields has resulted in me now recommending a more balanced portfolio. There is clearly no sign of this at present as financial stocks remain strong and the Reserve Bank recently confirmed lower domestic interest rates are here for a while.
Chart 23 – BHP Weekly Chart

Chart 24 – BHP Daily Chart

Chart 25 – Woodside (WPL) Monthly Chart

Chart 26 – RIO Tinto (RIO) Weekly Chart

Chart 27 – Fortescue Metals (FMG) Weekly Chart

Chart 28 – Vale (US) Weekly Chart

Chart 29 – Newcrest Mining (NCM) Monthly Chart

Chart 30 – OZ Minerals (OZL) Monthly Chart

Chart 31 – CBA Monthly Chart

Chart 32 – ANZ Bank (ANZ) Monthly Chart

Chart 33 – Westpac Bank (WBC) Weekly Chart

Chart 34 – National Bank (NAB) weekly Chart

Chart 35 – Macquarie Bank (MQG) Weekly Chart

Chart 36 – Bank of Queensland (BOQ) Weekly Chart

Chart 37 – AMP Weekly Chart

Chart 38 – Challenger Financial (CGF) Monthly Chart

Chart 39 – Suncorp Group (SUN) Monthly Chart

Chart 40 – Insurance Australia (IAG) Monthly Chart

Chart 41 – QBE Insurance Monthly Chart

Chart 42 – Wesfarmers Ltd (WES) Weekly Chart

Chart 43 – Woolworths Ltd (WOW) Monthly Chart

Chart 44 – Seek Ltd (SEK) Weekly Chart

Chart 45 – Real Estate Australia Group Ltd (REA) Monthly Chart

Chart 46 – Vocus Communications (VOC) Weekly Chart

Chart 47 – Telstra (TLS) Monthly Chart

Chart 48– M2 Group Ltd (MTU) Monthly Chart

Chart 49 – Crown Resorts Ltd (CWN) Monthly Chart

Chart 50– Ansell Ltd (ANN) Monthly Chart

Chart 51– CSL Ltd (CSL) Monthly Chart

Chart 52 Ramsay Healthcare (RHC) Monthly Chart

Chart 53– Resmed (RMD) Weekly Chart

Chart 54 Fairfax Media (FXJ) Monthly Chart

Chart 55 – Seven West Media (SWM) Monthly

Chart 56 Flight Centre (FLT) Monthly

Chart 57– Australian Dollar (AUD) Weekly Chart
The $A is looking choppy and is currently holding after a good bounce, with the potential to challenge the 97c area.

Commodities
Gold remains volatile moving me to 50-50 scenario that it may abc up towards 1400 or fall towards 1100.
Copper remains very negative on a longer term basis, a very similar chart pattern to Newcrest Mining (NCM) and unfortunately we all saw what happened there.
Iron Ore is plumbing 5 year lows but related stocks are definitely pricing this area to hold.
Chart 58 – Gold Monthly Chart

Chart 59 – Copper Weekly Chart

Chart 60 – Iron Ore Monthly

Please note this is my personal TECHNICAL opinion of markets and “General Advice” taking no account of individual’s circumstances.
Have a great week,
Shawn Hickman
marketmatters.com.au