Market Matters Weekend Report Sunday 1st September 2019
Last week the ASX200 bounced pretty much as MM has been expecting, we finally leave August and its unpredictable reporting season behind us in the rear view mirror. After the recent enormous macro driven volatility local stocks finally closed down 3% for the month, compared to the US which only finished 2% lower, a pretty poor Australian reporting season was probably the difference in performance between both markets. Under the hood the volatility was huge with 14% of the ASX200 closing down by 15% or more, whereas only 4% managed to close up to the same degree. When we consider the degree of damage inflicted on some local stocks following their disappointing reports the index declining only 3% feels ok.
The raw emotion of the market’s gyrations following comments / tweets from Presidents Trump and Xi Jinping has caused both bulls and bears to feel nervous throughout August. We have a market priced on the rich side as a recession looms on the horizon but with central banks attempting to maintain post GFC expansion via interest rates at all-time lows and ongoing / increased fiscal stimulus its easy to argue for both camps. Our feeling at MM is the market is embarking on a volatile / choppy correction where at MM we are sellers into strength above 6600 and buyers of weakness down towards 6200.
At this stage we still believe it’s just a matter of time before stocks experience another sharp decline, probably into October – subscribers should remember that picking “tops” is generally far harder than bottoms. Hence today’s report is going to focus primarily on how we plan to address our portfolio’s as the market trades above our targeted 6600 sell area.
The SPI futures are calling the ASX200 to open down a few points on Monday, we feel the local market is now approaching / around an inflection point, with a move downside likely to follow.
At MM we remain comfortable currently adopting a more defensive stance than over the first-half of 2019.
ASX200 Chart

The recent Bank of America Fund Managers Survey showed us that the number of fund managers who believe a recession is imminent has reached an 8-year high, courtesy of US-China trade concerns, but it still only sits at 64% – the yield curve inversion is certainly not worrying the whole market.
However with over 30% of fund managers acknowledging they’ve now taken out market protection against an aggressive decline in stocks into Christmas the likelihood in our opinion is the next sell-off will be bought – this is the highest reading since the GFC making it the most bullish survey since November 2008.
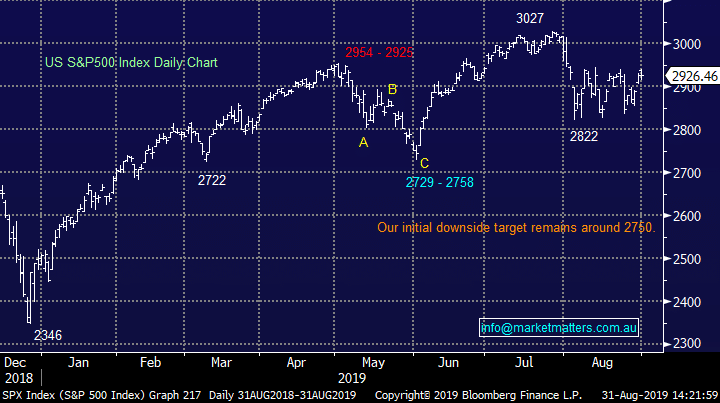
MM believes the US S&P500 will test 2750 in the next 1-2 months which should represent excellent buying short-term.
US S&P500 index Chart
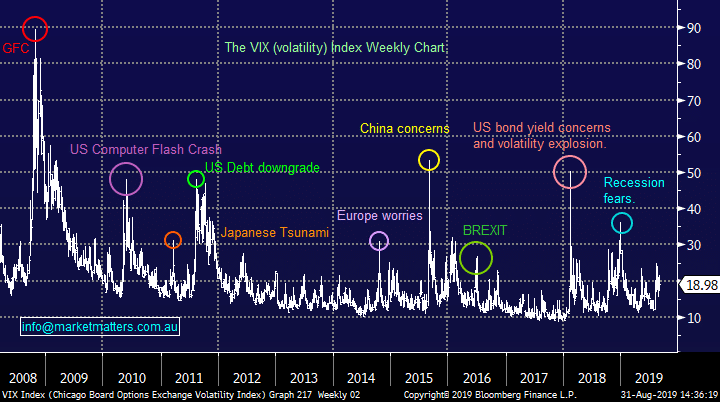
There are a number of indicators implying investors are too bearish and hence the longest equities bull market in history should continue but the Volatility Index (VIX) remains relatively low plus speculators are carrying the largest ever short VIX position via futures (report has been available for 15-years), a strong sign that we may see further market spikes in both directions over the months ahead.
MM believes that market volatility will continue to rise in 2019 / 2020.
US Volatility / Fear Index (VIX) Chart
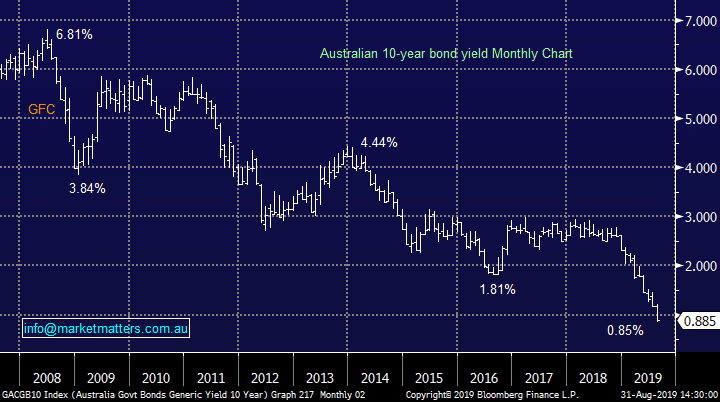
The US-China trade war escalation continues to have 2 major impacts on interest rate markets both of which make sense:
1 – Australian 10-year bond yields plunged to fresh all-time lows in August, like many of their global peers, and they remain rooted well under the RBA Cash Rate.
2 – The US 2/10 yield curve inversion continues which implies many traders / investors believe that the US is about to slide into a recession.
MM believes the RBA will cut interest rates at least once more in 2019/20.
Australian 10-year bond yields Chart
1 – The MM Growth Portfolio
The MM Growth Portfolio currently holds 18% in cash but we are now poised to become far more defensive in the days ahead : https://www.marketmatters.com.au/new-portfolio-csv/
While a squeeze higher towards 6650 would not surprise us the plan at MM is to move to a more conservative position now our 6600 target area has been achieved. Like everything with investing we can never be sure, except in hindsight, but our view is that on balance value / alpha can most likely be added to our portfolio (s) through being positioned for a decline towards 6200 in the weeks ahead. Hence the question “what are the MM plans for September?”, today we have looked at our plans for our stocks / sectors for the days / weeks ahead.
*Watch for alerts
The Banks
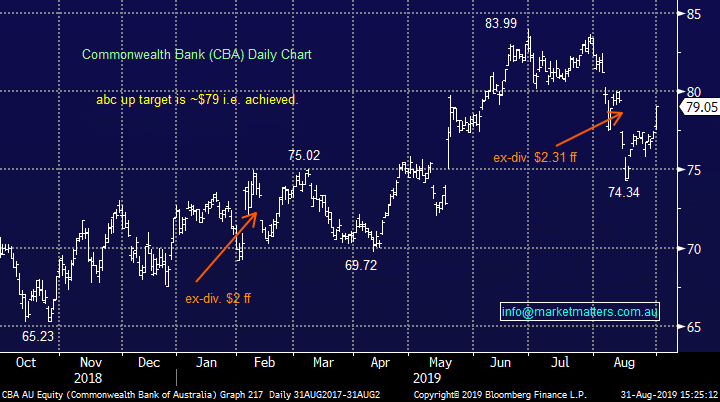
MM is holding a hefty 28% of our Growth Portfolio in the banks spread relatively evenly across ANZ Bank (ANZ), Bank of Queensland (BOQ), Commonwealth Bank (CBA), National Australia Bank (NAB) and Westpac (WBC).
While MM believes the banks will outperform over the next 6-12 months, largely due to their sustainable yield, a decent pullback in the index is likely manifest itself in some bank selling hence we plan to sell our least preferred bank next week with a view to increasing our exposure to another member of the sector into weakness. We went long Bank of Queensland in May looking for some potential merger talks but things have gone quiet on this front:
MM plans to close out our BOQ position next week.
Commonwealth Bank (CBA) Chart
Resources
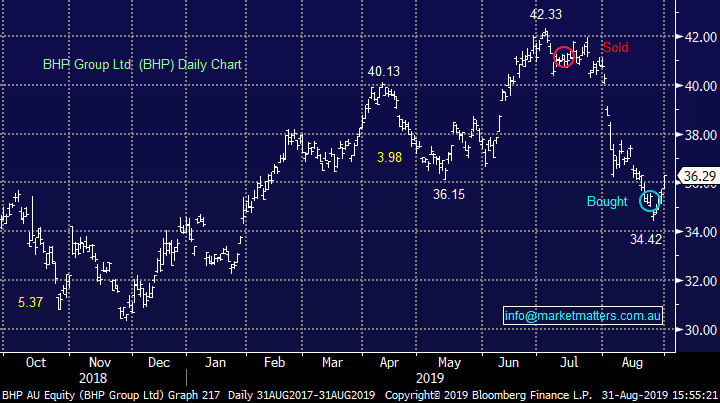
MM is holding 13% of our Growth Portfolio in iron ore / diversified resources through BHP Group (BHP), RIO Tinto (RIO) and Fortescue Metals (FMG) – RIO traded ex-dividend on the 8th of August while the other 2 go ex this week, paying healthy fully franked dividends.
The likelihood is we will leave these positions unchanged unless FMG roars through $8 next week before its trades ex-dividend i.e. led by iron ore popping another ~5%, never say never!
MM expects BHP to trade between $37 and $33 in Q$ of 2019 hence we will invest across the space accordingly.
BHP Group (BHP) Chart
Holdings we currently intend to sell / reduce – Adelaide Brighton (ABC), Costa Group (CGC) and Orocobre (ORE).
Holdings we currently like – Domino’s (DMP), Tabcorp (TAH), Emeco Holdings (EHL), Pact Group (PGH), Orica (ORI) and Janus Henderson (JHG).
Hence if we sell BOQ, ABC, ORE and reduce CGC as described above the Growth Portfolio’s cash position will increase to 29%.
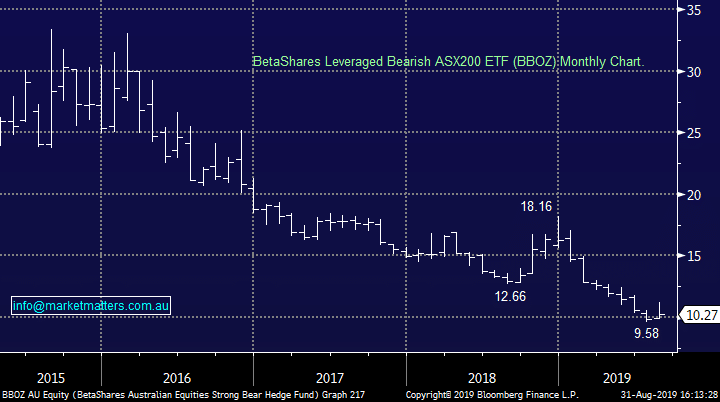
A cash position around 30% is fairly aggressive but we feel justified at current levels, and especially a touch higher. However if the market does squeeze towards 6650, another 1% higher, we may consider taking an even more aggressive stancen via the BetaShares bearish ETF (BBOZ), buying 1 /2 gold stocks plus of course selling other stocks in our portfolio that rally more strongly than anticipated.
BetaShares Leveraged Bearish ASX200 ETF (BBOZ) Chart
Obviously it’s a touch premature to start talking about stocks we are looking to buy but it never hurts to have a list to review of stocks we like if we are correct over September / October:
Add to our banks & / or iron ore exposure at appropriate levels.
A few stocks / companies we like into weakness – Appen (APX), OZ Minerals (OZL), Invocare (IVC), and Telstra (TLS).
2 MM Income Portfolio
No change last week, with our cash position sitting at 2% : https://www.marketmatters.com.au/new-income-portfolio-csv/
No major change, until we see any indication that bond yields have bottomed MM sees no reason to significantly reduce our market exposure, or re-position / skew holdings towards higher rates i.e. why hold cash in today’s market when yield / income is your objective.
Our thoughts around the portfolio was summed by last week’s Income Report and https://www.marketmatters.com.au/new-income-portfolio-csv/ and video update: https://www.youtube.com/watch?v=OgF4Ixan8xg&feature=youtu.be
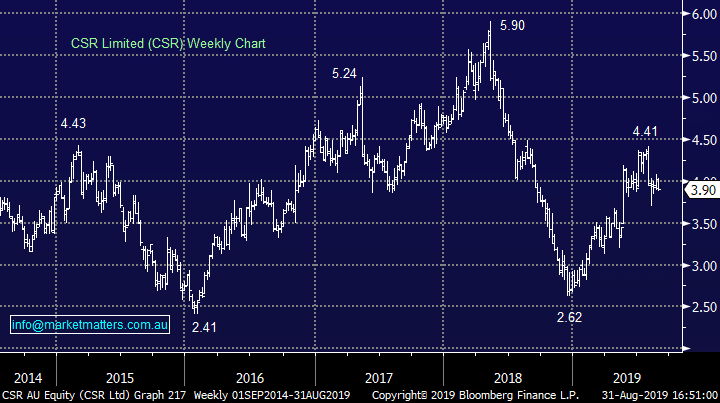
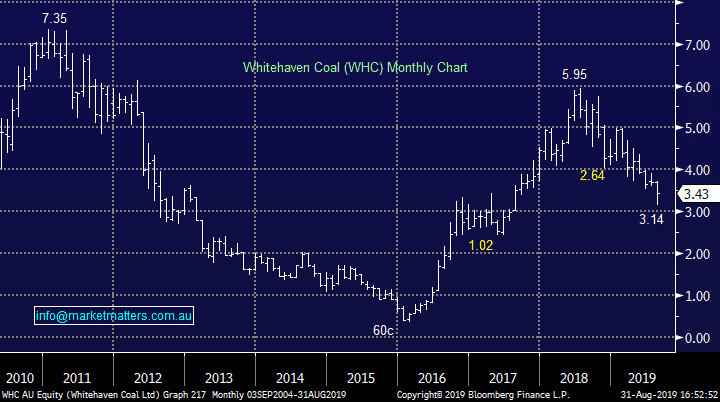
As we mentioned on Wednesday the 2 stocks we are considering liquidating at present are CSR Ltd (CSR) and Whitehaven Coal (WHC) especially as we only now hold 2% in cash – it would be nice to go “shopping” if stocks corrected ~6%.
*Watch for alerts.
CSR Ltd (CSR) Chart
Whitehaven Coal (WHC) Chart
3 – International Equites Portfolio
Recently I’ve written “Over the last few weeks we’ve seen global equities lose their “mojo” hence we remain comfortable playing a defensive game”, this still feels ok today : https://www.marketmatters.com.au/new-international-portfolio/ .
The MM International Portfolio is currently comprised of 75% in cash, 15% in stocks, 5% short the US index and 5% in a US gold stock (Barrick Gold). – this mix should remain steady on Monday morning.
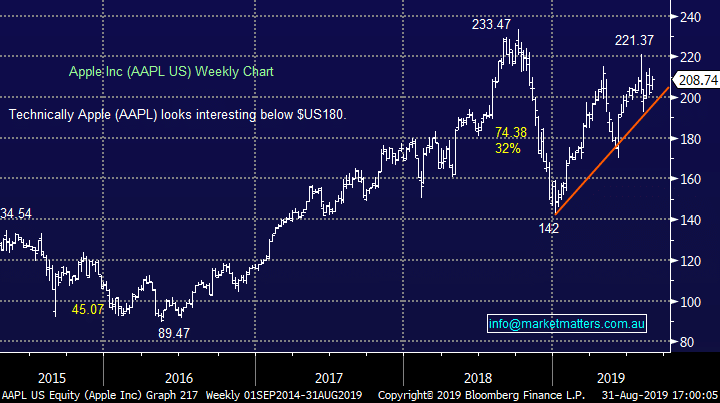
I know it feels boring but we have been patient so far and still feel this is the logical path while identifying our stocks to buy into weakness e.g. Asian facing companies like Alibaba (BABA), quality “blue chips” like Microsoft (MSFT US) plus other names that get sold off too aggressively if we get another leg down in risk assets.
*Watch for alerts.
Apple Inc (AAPL US) Chart
4 – MM Global ETF Portfolio
Again no major change last week with MM’s new Global ETF Portfolio – we are holding 3 positions, long both the $A and gold, plus we have a small short US equities position leaving us holding 80% in cash. Construction of this portfolio, similar to our International Portfolio, has been slow but opportunities are rapidly starting to present themselves. We are now seriously considering the following 4 positions / views:
1 – We believe US stocks are vulnerable to a deeper correction hence we are looking to increase our ProShares short S&P500 (SH US) from 5% to 10% above 2930 while we are also looking to take profit if stocks panic ~6% lower next month.
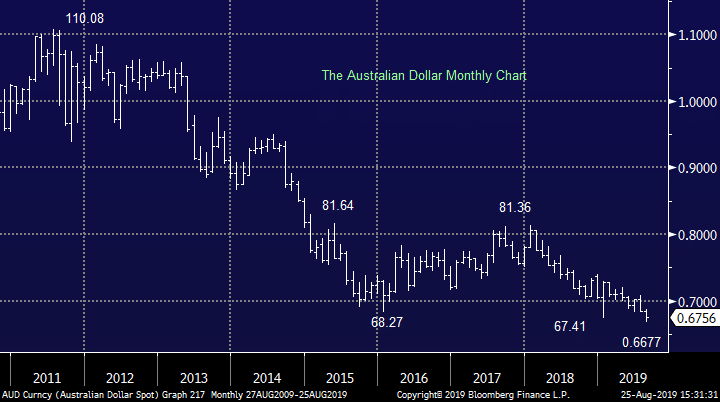
2 – Averaging our long $A position: the little “Aussie Battler” is holding up well with so much recession talk around, hence we are getting closer by the day to averaging our long position i.e. buy AUDS AU.
3 – MM remains keen to increase our exposure to precious metals with silver our vehicle of choice to add to our existing gold ETF. Our preferred ETF is the iShares Global Silver Mines ETF ( SLVP US) – https://www.ishares.com/us/products/239656/ishares-msci-global-silver-miners-etf
4 –Lastly MM believes volatility is too low considering the potential macro-economic risks and huge short position. Hence we feel the risk / reward of being long volatility from current levels makes sense, our preferred ETF is the VIXY US around the 22 level : https://www.proshares.com/funds/vixy.html
*Watch for alerts.
Australian Dollar ($A) Chart
Conclusion
The last few weeks have been about laying plans for when / if the ASX200 could rally towards the 6600 area. Now we have arrived MM believes its time for action and intend to adopt a more conservative / defensive position in our portfolio (s).
US stocks have triggered a sell signal with the break below the 2960 area by the S&P500, we continue to believe it’s time to sell rallies in the US i.e. basically now.
*Watch for alerts.
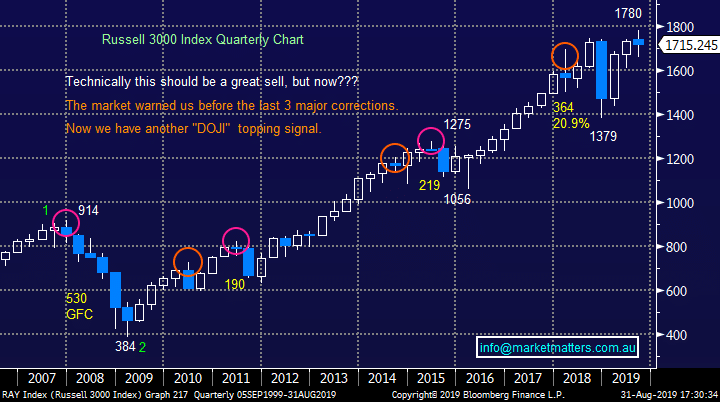
Chart of the week.
It will probably surprise many subscribers that the last quarter was relatively quiet but an ominous “DOJI” was formed i.e. on where the market tries to rally and fall but ends up basically unchanged. These are often formed when a market is about to change its trend. Since the GFC every major top was accompanied by a similar pattern.
MM believes the risk / reward is currently favouring the bears.
Russell 3000 Index Chart
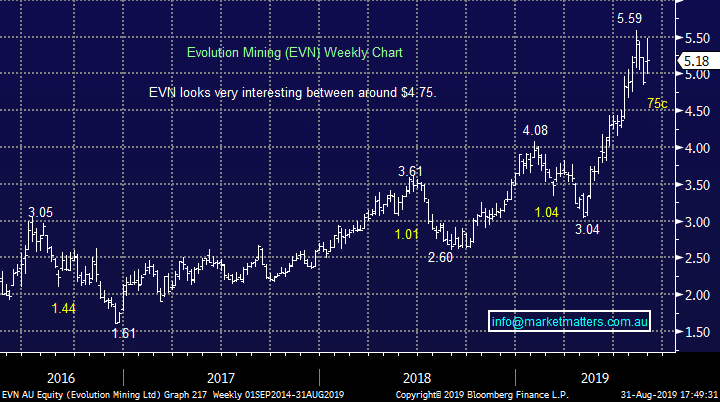
Investment of the week.
Gold slipped on Friday night which might help us buy 1 or 2 gold names into the current pullback, at least as a trading opportunity e.g. We like Evolution Mining (EVN) around 8% lower.
MM likes EVN around $4.75
Evolution Mining (EVN) Chart
Trade of the week.
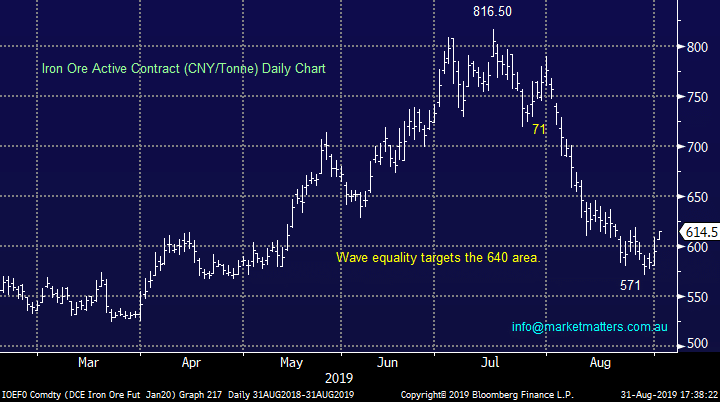
MM is long BHP Group (BHP), Fortescue Metals (FMG) and RIO Tinto (RIO) who track iron ore closely. We think the bulk commodity is poised to squeeze ~5% higher which if it takes the likes of FMG with it we believe is a good trading sell opportunity.
MM likes iron ore & related stocks for ~5% upside.
Iron ore (CNY/Tonne) Chart
Our Holdings
Our positions as of Friday. All past activity can also be viewed on the website through this link.

Weekend Chart Pack
The weekend report includes a vast number of charts covering both domestic and international markets, including stock, indices, interest rates, currencies, sectors and more. This is the engine room of our weekend analysis. We encourage subscribers to utilise this resource which is available by clicking below.

Have a great day!
James & the Market Matters Team
Disclosure
Market Matters may hold stocks mentioned in this report. Subscribers can view a full list of holdings on the website by clicking here. Positions are updated each Friday, or after the session when positions are traded.
Disclaimer
All figures contained from sources believed to be accurate. Market Matters does not make any representation of warranty as to the accuracy of the figures and disclaims any liability resulting from any inaccuracy. Prices as at 31/08/2019
Reports and other documents published on this website and email (‘Reports’) are authored by Market Matters and the reports represent the views of Market Matters. The MarketMatters Report is based on technical analysis of companies, commodities and the market in general. Technical analysis focuses on interpreting charts and other data to determine what the market sentiment about a particular financial product is, or will be. Unlike fundamental analysis, it does not involve a detailed review of the company’s financial position.
The Reports contain general, as opposed to personal, advice. That means they are prepared for multiple distributions without consideration of your investment objectives, financial situation and needs (‘Personal Circumstances’). Accordingly, any advice given is not a recommendation that a particular course of action is suitable for you and the advice is therefore not to be acted on as investment advice. You must assess whether or not any advice is appropriate for your Personal Circumstances before making any investment decisions. You can either make this assessment yourself, or if you require a personal recommendation, you can seek the assistance of a financial advisor. Market Matters or its author(s) accepts no responsibility for any losses or damages resulting from decisions made from or because of information within this publication. Investing and trading in financial products are always risky, so you should do your own research before buying or selling a financial product.
The Reports are published by Market Matters in good faith based on the facts known to it at the time of their preparation and do not purport to contain all relevant information with respect to the financial products to which they relate. Although the Reports are based on information obtained from sources believed to be reliable, Market Matters does not make any representation or warranty that they are accurate, complete or up to date and Market Matters accepts no obligation to correct or update the information or opinions in the Reports. Market Matters may publish content sourced from external content providers.
If you rely on a Report, you do so at your own risk. Past performance is not an indication of future performance. Any projections are estimates only and may not be realised in the future. Except to the extent that liability under any law cannot be excluded, Market Matters disclaims liability for all loss or damage arising as a result of any opinion, advice, recommendation, representation or information expressly or impliedly published in or in relation to this report notwithstanding any error or omission including negligence.


