Skip to Content
scroll

Qn on EST table in the Analysis section of MM

Our Q&As are emailed in our Saturday Morning Report, find the answer to this question below.

The Latest Q&A

Question asked

Qn on EST table in the Analysis section of MM

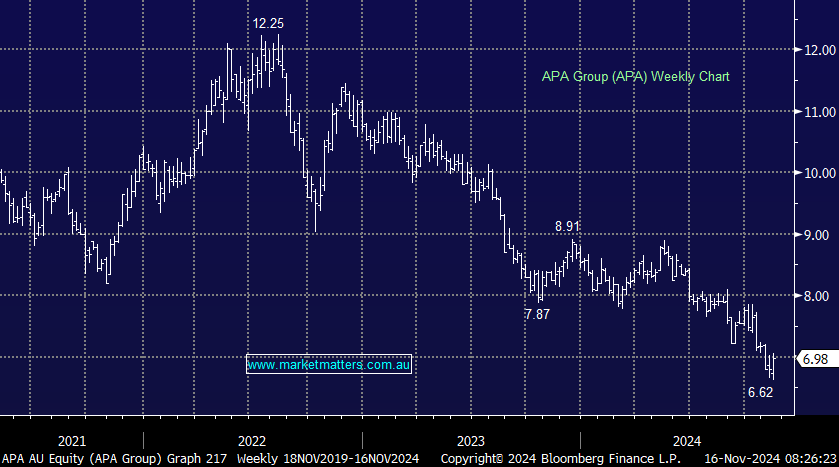
Hi, Question on the Estimate section of the ANALYSIS tab of MM, will use APA group as example - a) Can see the EPS in estimate vs current is very large: 0.17 vs 0.77, this is ~ 4.5 times, can you explain how the estimates are derived. Same for DPS as well, large drop. b) How does MM view this large drop? Does MM use the current data for its price valuation or from estimates? And how does MM usually use the information from the estimates table? c) On the subject of P/E ratio, can see MM has 8.8, but comsec has 43.6, why the big difference, good if you can provide your insight. Thanks, Jack

Answer

Hi Jack,

  • Estimates are the consensus market numbers from LSEG (used to be called Refinitiv) and they aggregate all analyst numbers and average them out. In the case of APA you can see there are 11 estimates used to create the consensus you referred to. Consensus is important.
  • APA is a tricky example given the nature of their business i.e. big regulated, capital intensive asset base and their accounts are tricky. The EPS number quoted in FY24 of 77cps was an anomaly which related to a re measurement of their interest in an asset to the tune of $880m.  In the case of APA, underlying EBITDA (as discussed in another question today) is our preferred measure, given the big impact on accounting for a large base of infrastructure given the impact of depreciation.
  • In the case of the DPS, the company guide is what we listen to, they generally guide well. This year, guidance is for 57cps.
  • The PE of 42x for FY25 is an estimated number based on Estimated EPS for the year ahead. The PE on the Market Matters site is the current or historical PE, relating to FY24 (actual) earnings – in this case 77cps.
  • Like the market we look at forward guidance but we don’t necessarily agree with consensus all the time- as the saying goes “that’s what makes a market”.
  • Our preferred measure to price APA is using its yield relative to 10-year bond yields, looking at the spread, which is currently ~4.5% – historically high. We like APA here.
chart
image description
APA Group (APA)
Back to top