Hi Robert,
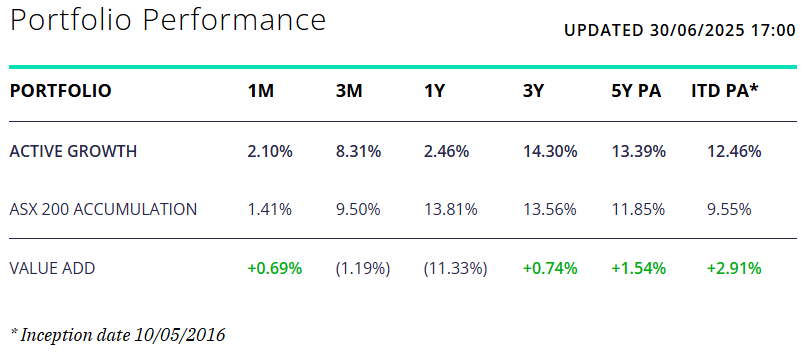
Thanks for the appreciation! A very fair and valid question and one that we can provide insight to. It’s been the weakest relative year for our growth portfolio since launch in 2016, underperforming by 11% (not 15%). Importantly though, looking back in time, performance remains solid over longer time frames, and if you think about how weak relative returns have been this year, by definition it also shows the strength in prior years (i.e. growth portfolio was running ~5% pa ahead of market since inception prior this FY).
- Many experinced investors will tell you to back good managers after a tough period, and that is the message we would also stress at this time. It’s the same for stocks – i.e. buy the quality stocks where the longer term trends are good, but they’ve had a period of weakness for a particuar (non-structural) reason.
3 main reasons:
- Not owning CBA in the Growth Portfolio cost us ~5% relative to the index.
- We held an overweight position in resources which weighed, primarily from Mineral Resources (MIN) -4%, Iluka (ILU) -1.5%, Paladin (PDN) -1.4% and Whitehaven Coal (WHC) -1.4% – combined to detract 8.3% from portfolio returns.
Full data is not yet available for all fund managers in FY25, but most large cap managers likely underperformed due to CBA’s influence. Also important to note, we are higher conviction than most, holding a max of 20 stocks, meaning that deviation from the index can be higher – generally on the upside in years gone by, but unfortunately not the case in FY25.
- While only early days in FY26, the growth portfolio is +2.6% relative to the index which is +0.72% i.e. +1.88% outperformance. Stick with us, things will improve after a tough year for this strategy.


