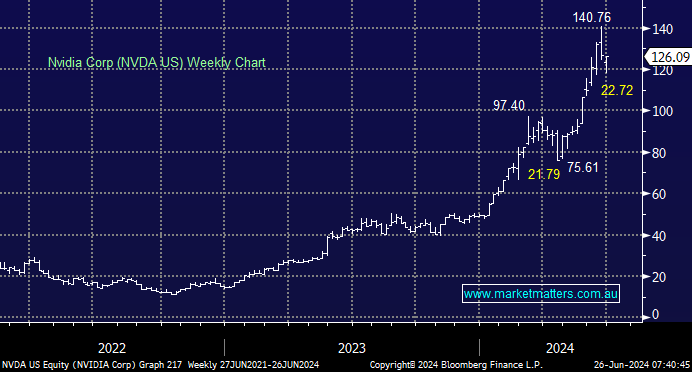
The most widely discussed and covered stock on the planet is Nvidia (NVDA US), which designs, manufactures and ultimately sells a lot of very sophisticated graphics processing units (GPUs), originally designed to simulate human imagination, enabling the virtual worlds of video games and films. They have since leveraged the same architecture to create platforms for data science, artificial intelligence, autonomous vehicles, robotics, 3D applications and other cutting-edge solutions. As the demand for these sorts of applications increased, their sales exploded, and so too did the share price.
The simple way the market values a company is by looking at its earnings and applying a multiple to those earnings, which gives a traditional price-to-earnings ratio (P/E). When earnings are growing very strongly, the multiple applied to those earnings also increases, and the value of the stock will rise significantly. For instance, if earnings increase 100% and the multiple the market is prepared to pay for those earnings goes up 50%, then the share price will be up 300% (assuming no new issuance of shares).
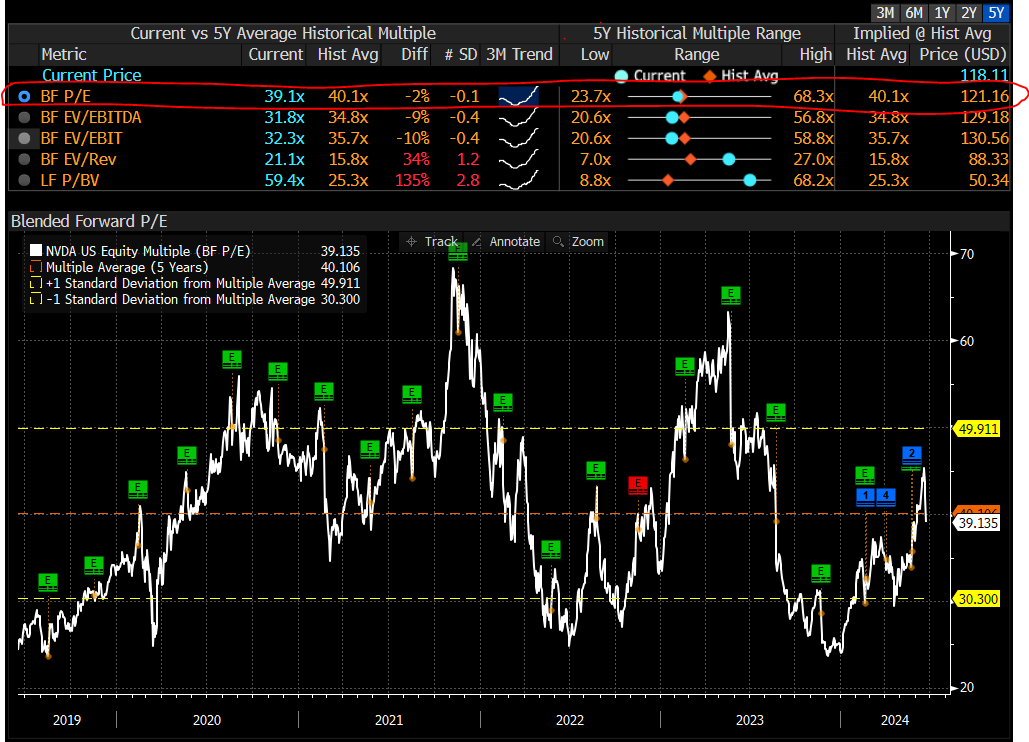
However, as the German proverb suggests ‘trees don’t grow to the sky’, we often see both earnings and multiples mean revert, which implies they come back to the average over time. While analysts have typically underestimated the earnings of NVDA, there are now 72 analysts that cover the stock, making it (from what we can tell), the most covered stock in the world. Therefore, we think ‘consensus’ has a fair amount of validity. That being the case, we can then use the multiple relative to the historical average for a guide to investing.
At the start of 2024 when the stock had rallied 300% in the prior year to ~US$50, NVDA was actually on the cheapest forward earnings multiple in 5 years at 23.7x. We then saw further earnings growth juiced up with an expansion in PE, and the stock price hit a recent high of $US140, up nearly ~3x. We missed the move, which is frustrating, however, we learn from these experiences.
In the recent run-up in share price, NVDA reached an earnings multiple of ~45x, about 15% ‘expensive’. In the last week, NVDA corrected ~20% to take it back to its average multiple. i.e. it’s not expensive vs history – it’s about average.
chart

NVDA Current vs 5-year average historical multiple – Source Bloomberg
chart
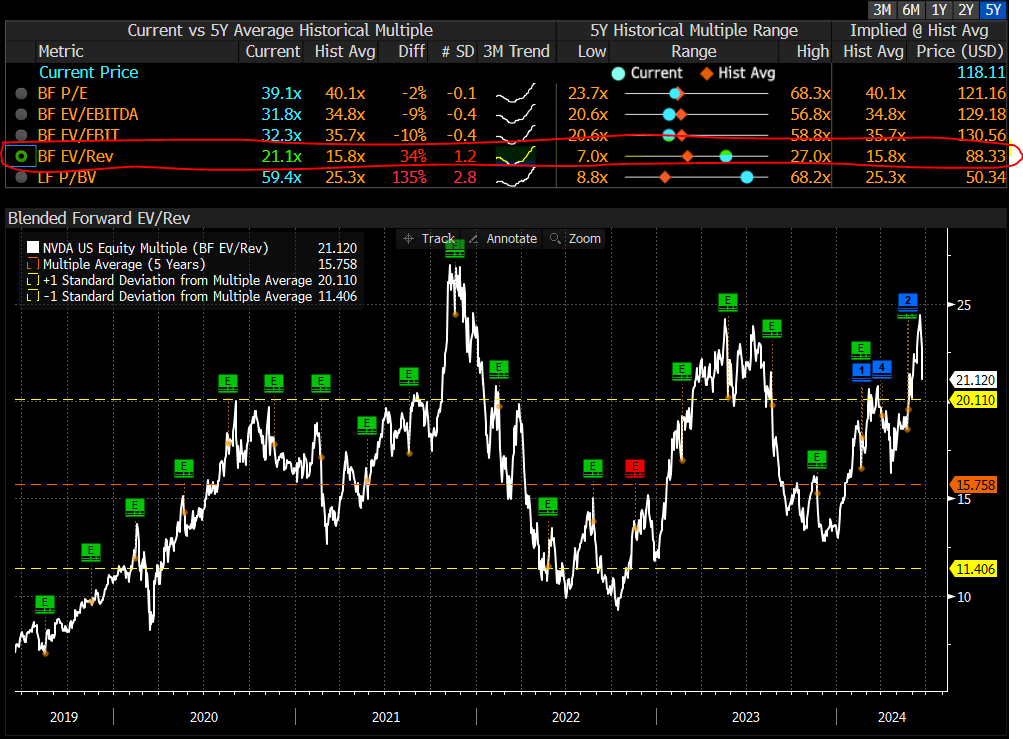
NVDA Current vs 5-year average historical multiple – Source Bloomberg
In a growth stock like this, revenue is very important. Top-line or sales growth is a pure reflection of demand and how the company is meeting that demand. Using Enterprise Value (EV) divided by Revenue to asses this, where EV is the Market Cap + Total Debt−Cash – i.e. it takes out the distortions, NVDA is trading on 21.1x versus its 5-year average of 15.8x, making it around 34% ‘expensive’.
chart
NVDA Current vs 5-year average historical multiple – Source Bloomberg
chart
NVDA Current vs 5-year average historical multiple – Source Bloomberg
While this approach is a simple one, we don’t mind simplicity at MM, and when overlaid with a clear risk/reward framework, the strategy works on these sorts of stocks. Taking the mid-point of the price implied by the average PE, which is $US121 and the price implied by the average EV/Rev multiple, which is $US88, we get a price point of US$104.50 based on current consensus numbers.
- Therefore, accumulating NVDA ~$105 makes sense, and leaving room to add to a position should it fall into the ‘cheap’ zone nearer $US90. Buying above $120 does not make sense based on what we know now.
MM believes NVDA is approaching an accumulation level.
Add To Hit List