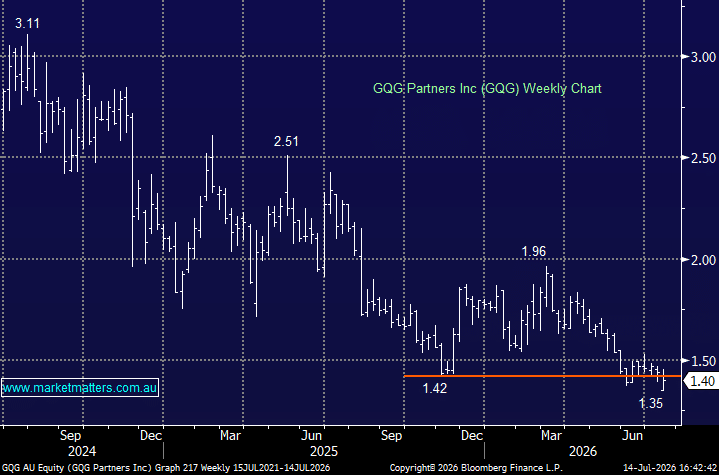
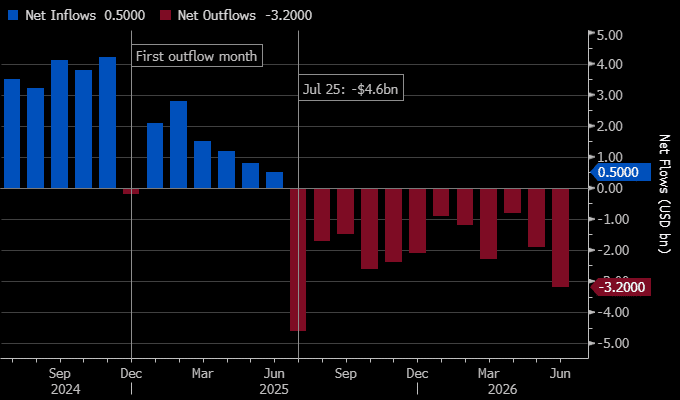
This week GQG reported FUM of $156.0bn as at June 30, 2026, down 4.5% month-on-month, and down 9.5% year-on-year from $172.4bn at June 2025. Net outflows of $3.2bn in June were the largest monthly outflow in 2026, marking 12 consecutive months of net redemptions a significant redemption cycle for a business whose revenue is almost entirely management-fee driven. Like all fund managers, GQG generates earnings from the money it manages, and as this falls, so does the company’s profitability, but with the stock trading ~20% below its long-term valuation, it’s priced for more bad news, and too pessimistically in our opinion, assuming it can stem the outflows.
Performance has been the primary reason for the outflows:
- A structural underweight to technology and AI-related stocks proved costly for GQG, with the AI-fuelled rally of 2024–25 rewarding momentum over traditional valuation disciplines.
We feel GQG has almost become a hedge against the “AI Trade”, but the market hasn’t agreed over recent times despite its ~10% forecast yield. Interestingly, while GQG has been openly sceptical of the AI trade, its rhetoric has become noticeably more pragmatic, with management now signalling a willingness to adjust exposures as opportunities arise—reflected by the rapid increase in tech holdings, including Nvidia becoming its second-largest position (5.8%) in early July, suggesting a shift from outright scepticism to selectively “renting the bubble.”
- It will be interesting in August when GQG delivers its half-year result to see if GQG added to its AI exposure during the recent volatility.
Rajiv Jain’s portfolios made money even as clients were pulling it, but at a rate insufficient to fully offset the exodus. For a firm running 77% operating margins charging ~48 basis points, every billion in net outflows is a direct hit to the bottom line and for now, the stock needs the below chart to show some blue, or at least less red.
chart

GQG Partners Inc (GQG) Net In/Outflows – Source Bloomberg
chart
GQG Partners Inc (GQG) Net In/Outflows – Source Bloomberg
The numbers tell the story; the $25.2bn in cumulative outflows represents an annualised drag of roughly $96m on annualised EBITDA and $71m on net income, equivalent to approximately 15% of FY2025 net income, but over the same period the stock has fallen over 40% before taking into account dividends. This is partially offset by market appreciation on remaining FUM, but the structural revenue erosion is significant given GQG’s relatively high fixed-cost base relative to its fee income. GQG’s undemanding valuation is no surprise – trading on just 6.7x. It’s clearly priced for ongoing outflows and the first sign this is abating will likely see a 20-30% rerating in the blink of an eye.
- We believe GQG still presents an attractive defensive play helped by its ~10% div yield.
NB: GQG was downgraded to sell this morning by Goldman Sachs – although their target price is inline with the current share price ($1.40)
MM is long and cautiously bullish GQG ~$1.40
Add To Hit List