- What Matters Today in Markets: Listen here each morning or find all Market Matters Podcasts on Spotify.
The expected policy path of central banks, especially the RBA and the Fed, has been the main driver of the ASX’s relative performance in recent weeks. The chart below of US and Australian short-dated bond yields illustrates the divergence that weighed on local risk assets – Australian 3-year bond yields increased ~0.5% from their recent lows while the US 2s edged down towards fresh multi-year lows.
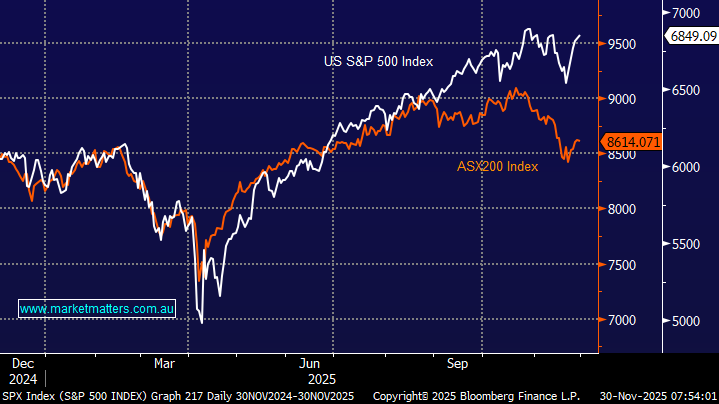
- Last month, the ASX200 retreated 3% while the US S&P 500 gained +0.1% and European indices closed largely unchanged.
- Admittedly, the tech-based NASDAQ slipped -1.6% as valuations around the “AI Trade’ were called into question, delivering very polarised performance across US tech.
Jerome Powell (Fed) and Michele Bullock (RBA) are expected to walk divergent paths over the coming 12-months, exerting very different influences on stocks:
- There is growing talk in Australia that the next move by the central bank is more likely to be a hike than a cut, although the futures are still leaning towards no change – a potential headwind for equities.
- The US Fed is expected to ease rates this month, plus another two and potentially three more cuts in 2026 – a tailwind for equities.
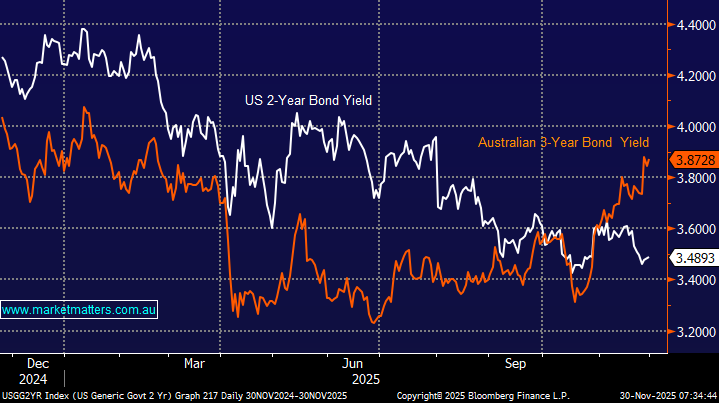

The S&P 500 and ASX200 have danced to the same jig since last Christmas until we entered September and bonds started to generate opposing signals, courtesy of differing economic signals. The divergence accelerated in November as local inflation remained “sticky” while in the US Fed members have become increasingly vocal around a rate cut next week.
- MM believes the RBA will be reticent to change rates through 2026, but we feel that 4 cuts by the Fed is as good as it gets and we will see another chapter for the doves in the coming months.
- Hence, we believe the recent underperformance by the ASX driven by interest rates is already maturing.
NB Economic “Doves” are people who favour lower interest rates and want to boost jobs and economic growth, even if it means allowing slightly higher inflation.