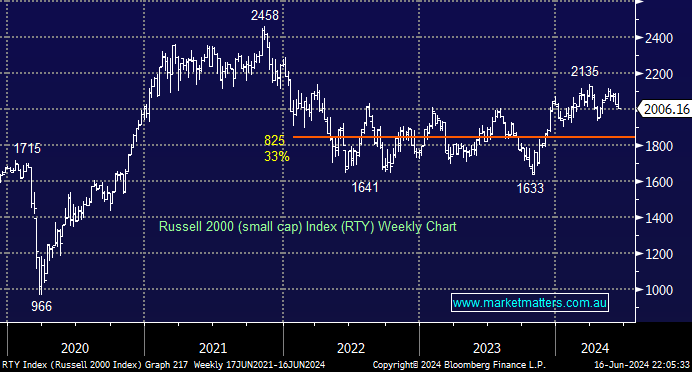
The S&P500 and NASDAQ are trading around their all-time highs, and after previously looking at the NYSE Advance-Decline (A-D) Line this morning, we have reverted to the small-cap Russell 2000 Index. As we said last week, when liquidity starts to dry up, it typically affects the small caps first. The chart of the Russell 2000 tells a very different tale from its large-cap peers, with it topping out for the year in late March, well below its 2021 high – most certainly not as bullish as the majors.
- We aren’t turning bearish on stocks, but the Russell 2000 is another reason MM is treading carefully.
MM is neutral towards US stocks
Add To Hit List