Market sells off from early high as profit taking threat looms (TLS, HVN, SUN)

WHAT MATTERED TODAY
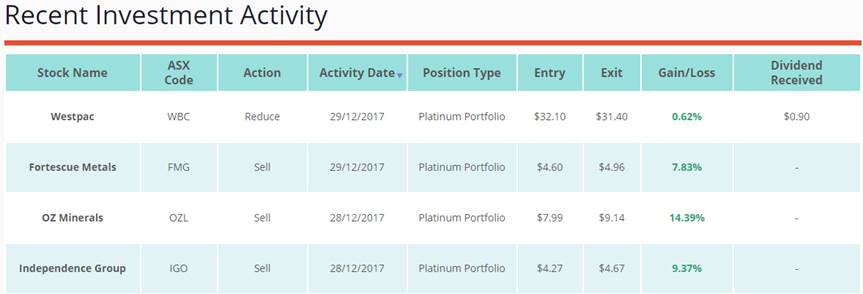
First day back in the office after the Christmas break although we were reasonably active throughout the period increasing cash levels in the Growth Portfolio to 26.5% - we’ll cover this below however the market was pretty well behaved over the Christmas period and again today, although we saw early strength today being sold into - a theme that we think will play out more and more as investors come back online. We typically see a bullish December, early part of January met with some selling which more often than not leads to a weaker start to each calendar year.
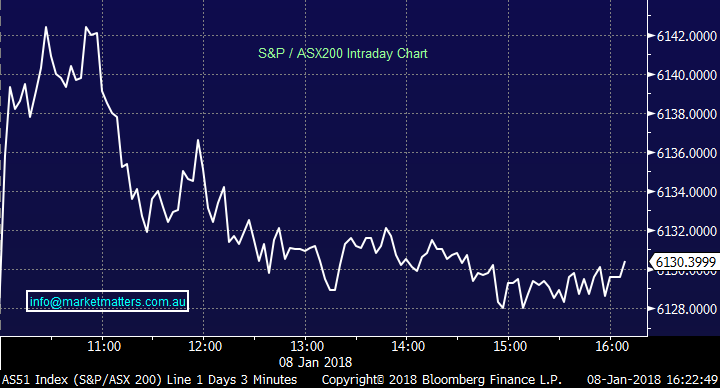
On the market today, we had an overall range of +/- 19 points, a high of 6143, a low of 6124 and a close of 6130, up 8pts or +0.13%
ASX 200 Intra-Day Chart – morning optimism sold into
ASX 200 Daily Chart
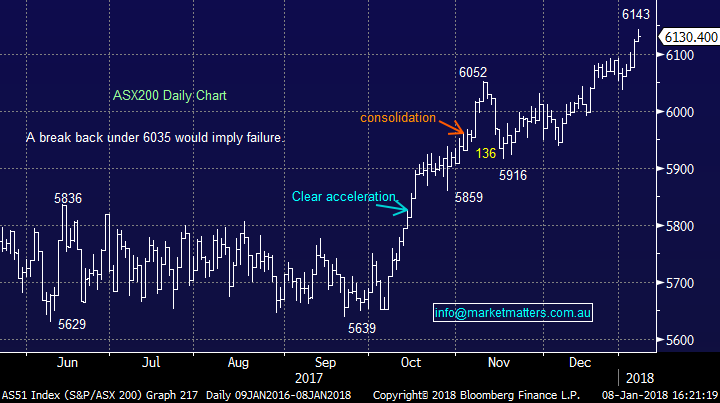
The market has simply been on an extended run north from the start of October putting on around ~8% to today’s high of 6143. Two observations worth noting. 1 - All of the calendar 17 gains came at the end of the year. 2 - We’re starting the year following a big Q4 gain which means we’re clearly susceptible to some profit taking, which will likely kick in once institutional managers get their feet under the desks, plan for the year ahead, look at funding redemptions and simply increasing cash given the mkts recent strength. The market does appear extended in the short term and we are wearing our sellers hat - with our buyers hat in the cupboard for now.
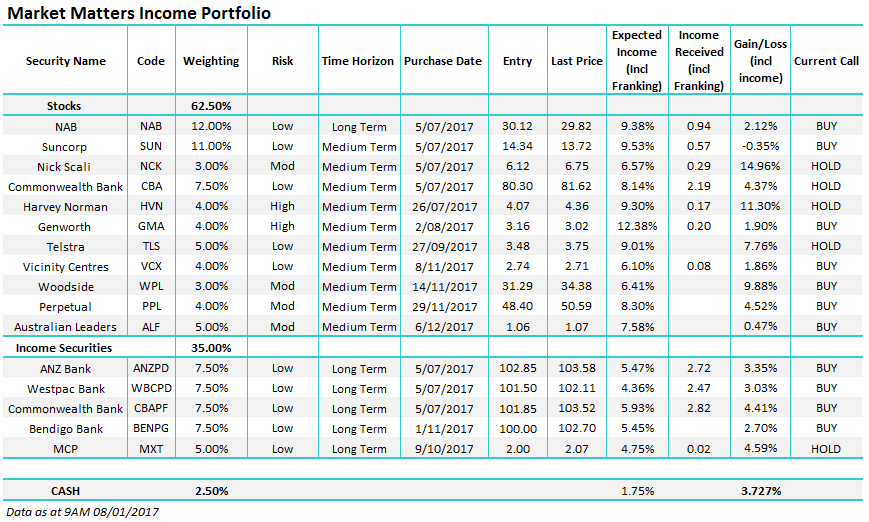
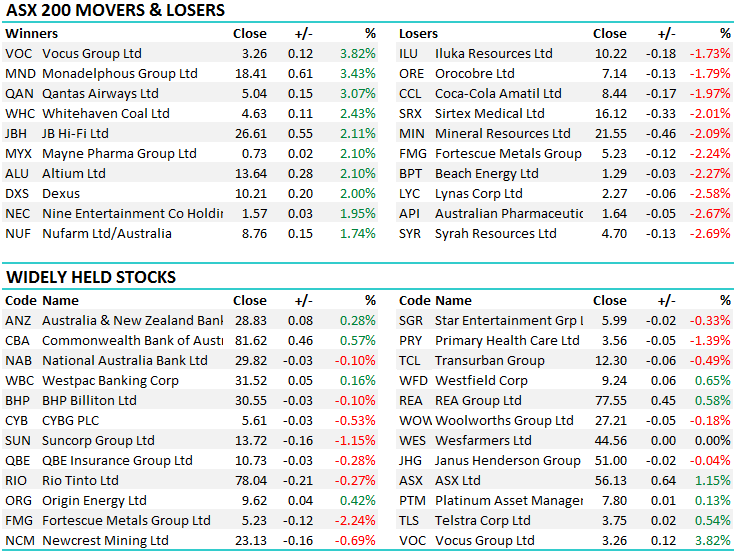
On the market today, some love once again finding its way into the unloved stocks / sectors of 2017 which can often be the case. Discretionary retailers were strong - Harvey Norman particularly so adding nearly 1% in an overall flat market. Interestingly enough, and this speaks to the idea that its worth considering sectors that are getting beaten up in the media, our two best performing holdings in the Income Portfolio are Harvey Norma and Nick Scali – companies that were no longer relevant in a post Amazon world (apparently).
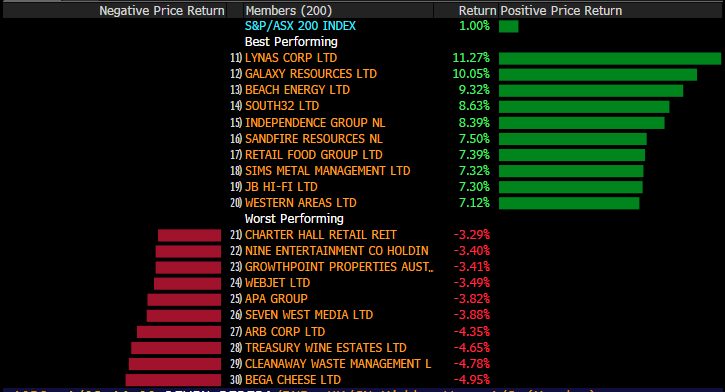
Looking at the sectors that have most strength since our last report on the 20th December, the Energy Sector was the place to be with our position in Woodside in both portfolios benefitting from continued strength in Crude. As we wrote in our 2018 Outlook this morning, we expect Crude to trade up to $US70/bbl this year dragging the energy names higher. Elsewhere, despite strength in the overall market, the interest rate sensitive sectors, the Utilities and the Real Estate stocks have struggled since our last missive on the 20th of December. In terms of the property sector, REITs finished 2017 underperforming the broader ASX equities index both for the month of December and on a calendar year basis, snapping a 3 year “winning streak." Relative performers over 2017 included CNI, ABP, PLG, GDI and CHC while relative underperformers were led by the large Retail landlords SCG and VCX. At this juncture, the sector remains expensive trading at a 29% premium to NTA (as at 31 Dec 2017), well above its longer term average of ~21%.

Now turning to specific stocks, the material names dominate the best performers over the period - we held Independence Group (IGO) in the Growth Portfolio however used the prevailing strength to take profits. We also own Webjet which is down around 3.50% since our last report, however we remain keen on this holding, showing an ~8% paper profit.
In terms of the MM Portfolios, we listed these this morning, however to recap we are currently holding;
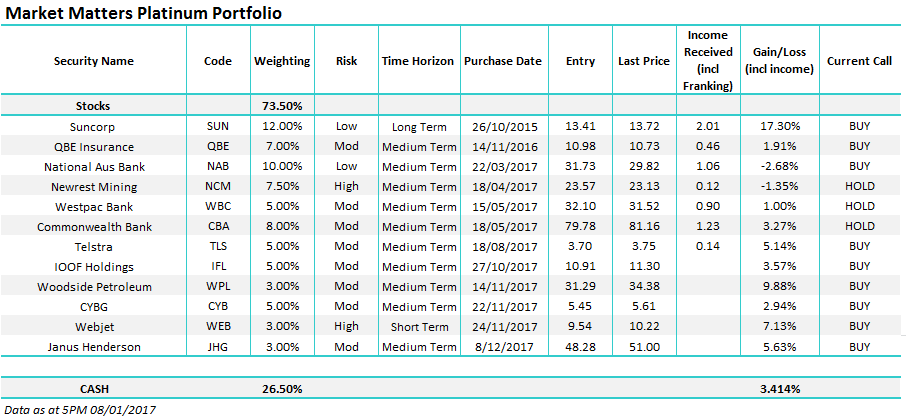
Over the break we took the following actions; All in the Growth Portfolio
TOP MOVERS
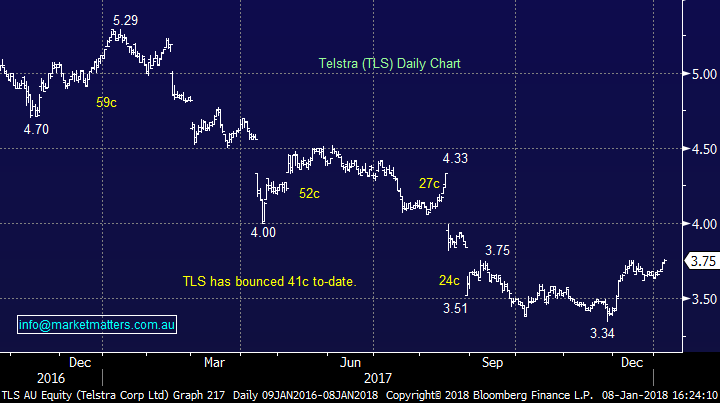
1. Telstra (TLS) $3.75 / 0.54%; We own TLS in both portfolios and are up in each. Our plan remains to be sellers on a move above $3.85, however we’d be keen buyers again below the 12 month low of $3.34
Telstra Daily Chart
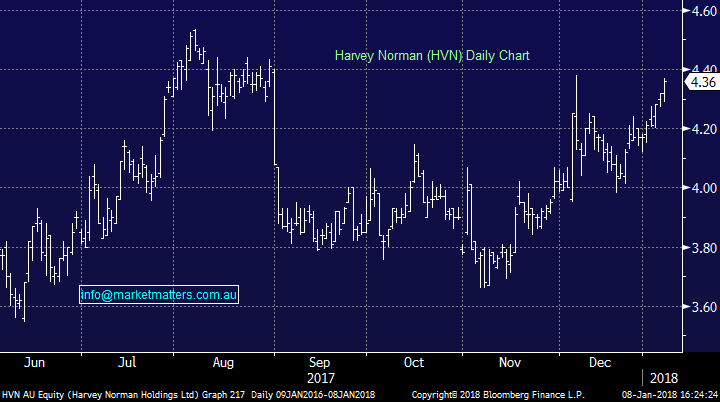
2. Harvey Norman (HVN) $4.36 / 0.93 %; We bought around $4 in the Income Portfolio and will be keen sellers closer to $4.60 - we’ve also picked up the dividend.
Harvey Norman Daily Chart
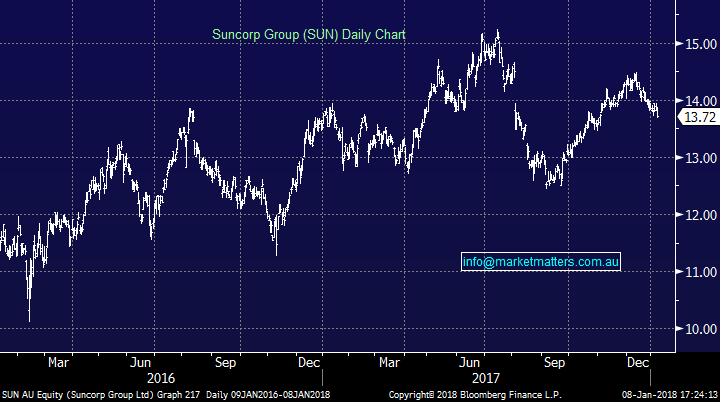
3. Suncorp (SUN) $13.72 / -1.15%; the company out today with a profit warning saying that their first-half results will take a hit courtesy of the hailstorm in Melbourne last month. The claims are primarily home and vehicle however it puts SUN over its cap. The coy has a total natural hazard cap at $360m however for the six months to December 31 they are currently sitting around the $410m mark which isn’t good but not a huge issue on initial look. Shares were obviously off but not a lot. We own SUN
Suncorp (SUN) Daily Chart
OUR CALLS
No changes to the portfolio’s today…
Have a great night
James & the Market Matters Team
Disclosure
Market Matters may hold stocks mentioned in this report. Subscribers can view a full list of holdings on the website by clicking here. Positions are updated each Friday, or after the session when positions are traded.
Disclaimer
All figures contained from sources believed to be accurate. Market Matters does not make any representation of warranty as to the accuracy of the figures and disclaims any liability resulting from any inaccuracy. Prices as at 08/01/2018. 5.00PM
Reports and other documents published on this website and email (‘Reports’) are authored by Market Matters and the reports represent the views of Market Matters. The MarketMatters Report is based on technical analysis of companies, commodities and the market in general. Technical analysis focuses on interpreting charts and other data to determine what the market sentiment about a particular financial product is, or will be. Unlike fundamental analysis, it does not involve a detailed review of the company’s financial position.
The Reports contain general, as opposed to personal, advice. That means they are prepared for multiple distributions without consideration of your investment objectives, financial situation and needs (‘Personal Circumstances’). Accordingly, any advice given is not a recommendation that a particular course of action is suitable for you and the advice is therefore not to be acted on as investment advice. You must assess whether or not any advice is appropriate for your Personal Circumstances before making any investment decisions. You can either make this assessment yourself, or if you require a personal recommendation, you can seek the assistance of a financial advisor. Market Matters or its author(s) accepts no responsibility for any losses or damages resulting from decisions made from or because of information within this publication. Investing and trading in financial products are always risky, so you should do your own research before buying or selling a financial product.
The Reports are published by Market Matters in good faith based on the facts known to it at the time of their preparation and do not purport to contain all relevant information with respect to the financial products to which they relate. Although the Reports are based on information obtained from sources believed to be reliable, Market Matters does not make any representation or warranty that they are accurate, complete or up to date and Market Matters accepts no obligation to correct or update the information or opinions in the Reports.
If you rely on a Report, you do so at your own risk. Any projections are estimates only and may not be realised in the future. Except to the extent that liability under any law cannot be excluded, Market Matters disclaims liability for all loss or damage arising as a result of any opinion, advice, recommendation, representation or information expressly or impliedly published in or in relation to this report notwithstanding any error or omission including negligence.
To unsubscribe. Click Here


