Market Matters Afternoon Report Wednesday 24th August 2016
Good Afternoon everyone
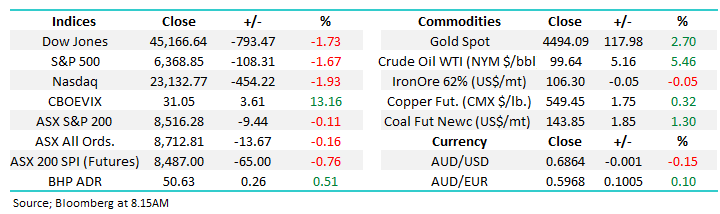
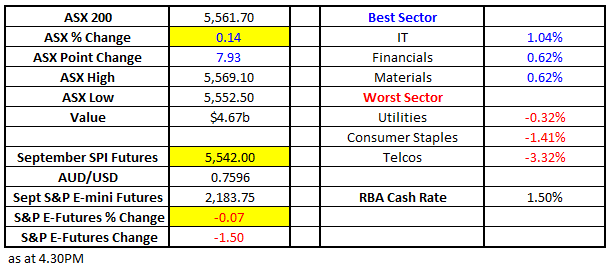
Market Data
What Mattered Today
Back to a fairly lethargic day today with the index up smalls, however, there was a couple of bigger stocks trade ex-dividend, Telstra (TLS) by 15.5cps and AGL Energy (AGL) by 36.0cps. TLS dropped 19c in aggregate (and took 7 index points from the market) which AGL was down 25cps – so not a bad result really.
ASX 200 Daily Chart
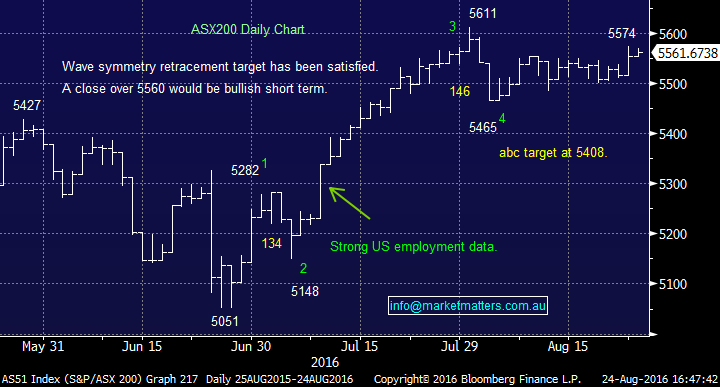
We had a range of +/- 17 points, a high of 5569, a low of 5552 and a close of 5553, up +8 points or +0.14%. Banks pretty well bid again with Westpac (WBC) leading the charge up +1.12% to finish at $30.75. We hold Westpac in the MM Portfolio looking to sell into strength.
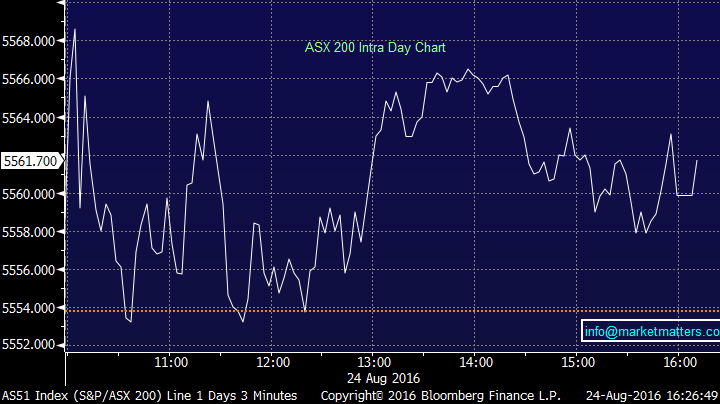
ASX 200 Intra Day Chart
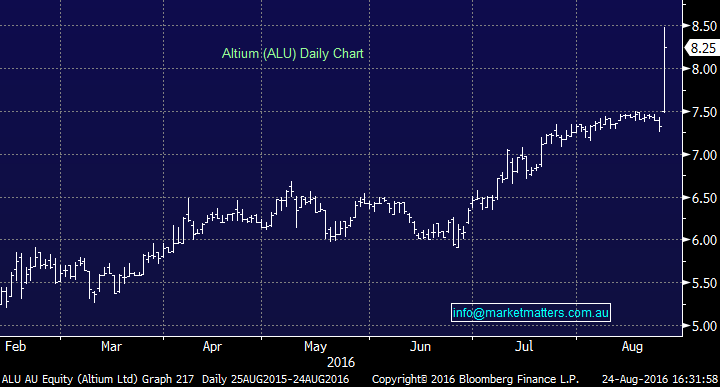
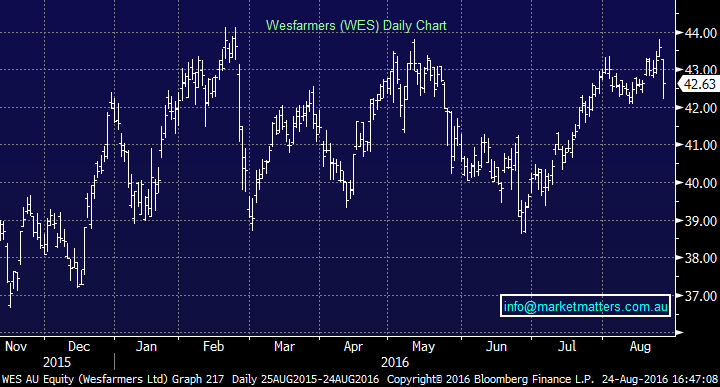
Elsewhere, reporting continued to dominate with good numbers from Ardent Leisure (AAD), Altium (ALU) – a more speculative mid cap growth stock we wrote about some months ago, Qantas (QAN) which announced a surprise dividend of 7cps, Boral (BLD) which printed good numbers however commentary was a little soft, Qube Logistics (QUB) which continues to perform well, while the largest to report today – Wesfarmers (WES) was inline – yet the market sold the stock off -2.18% to close at $42.63.
Altium (ALU) Daily Chart
Worley Parsons (WOR) was interesting reporting FY16 earnings of $153.1m – which was smack in the middle of consensus although 2H revenue decline is not a good look – and was presumably the reason for much of today’s weakness. The stock closed down -2.65% after dropping almost 6% yesterday.
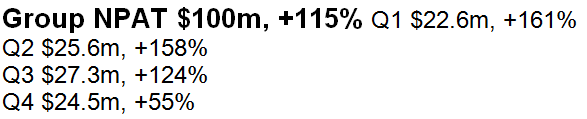
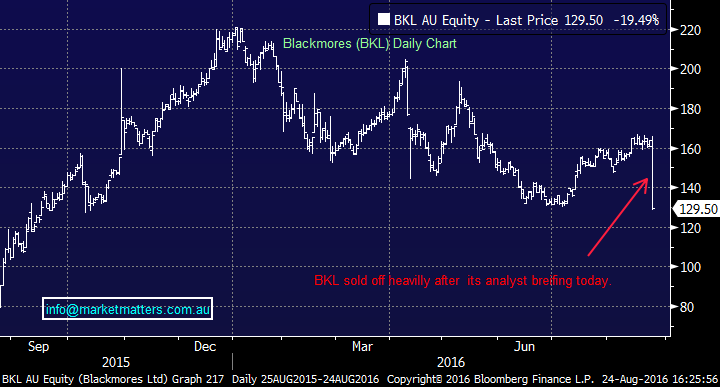
Blackmores (BKL) –the market darling of recent times dropped 19.49% today highlighting the risk of expensive ‘growth stocks’ that disappoint. Three of the more interesting elements of the result was commentary on expenses – which have gone up significantly (only a portion of which is a result of higher sales), while they also said there has been a softening of the wholesale market.
Most telling is the snippet from their presentation that showed group Net Profit After Tax (NPAT) showing only marginal growth from Q1 to Q4…Not the numbers that a growth stock, trading on 30 times should be printing…
Three interesting things to cover this afternoon;
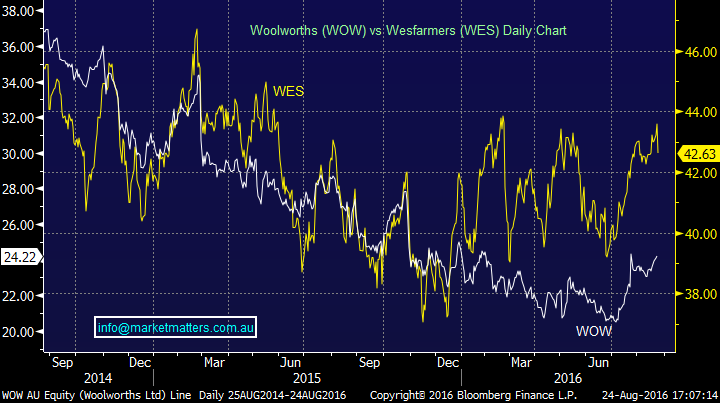
Woolies v Wesfarmers…we’ve written about this theme in a morning report recently and we had more colour around Wesfarmers today while Woolies reports tomorrow.
Today, WES announced FY16 profit of $2,353m (1H $1,393m, 2H $960m), -3.6% below pcp, and largely in line with market consensus. No major changes FY 17 numbers by the look of it however the stock was down. Coles is the key to Wesfarmers and it continued to impress with like for like sales in Food and Liquor up by 4.1% - maintaining the impressive 4-5% range of the past few quarters.
The issue with this stock is the multiple. It’s on 20x and its’ gotten there by the unravelling of Woolworths (WOW). Investors have been happy to pay a BIG premium for WES over WOW because WOW performance has been so poor. That trend is starting to charge. While LFL sales growth from Coles is likely to be a negative for Woolies result tomorrow, WOW is starting to turn the corner. Any incremental improvement by WOW food and liquor business tomorrow will be taken favourably from the market.
Wesfarmers (WES) Daily Chart
Below is the comparative performance between WES (Yellow) and WOW (White) over the past few years.
Staying with comparisons, the chart below shows the price of Iron Ore in white, Fortescue (FMG) in yellow and Rio Tinto (RIO) in red. In early 2015 RIO was tracking the Iron Ore price closely, yet Fortescue (FMG) had this whiff about it given high debt levels. A resilient Iron Ore price, conscious deleveraging, risk-on appetite etc has prompted a BIG rally in FMG leaving RIO well behind.
It seems money that may normally be attracted to RIO for Iron Ore exposure has gone into FMG. In our view, FMG has run too hard too fast. It now trades on 1x book v RIO which is nearer to 0.7ofbook. SELL FMG – BUY RIO seems the logical trade here.
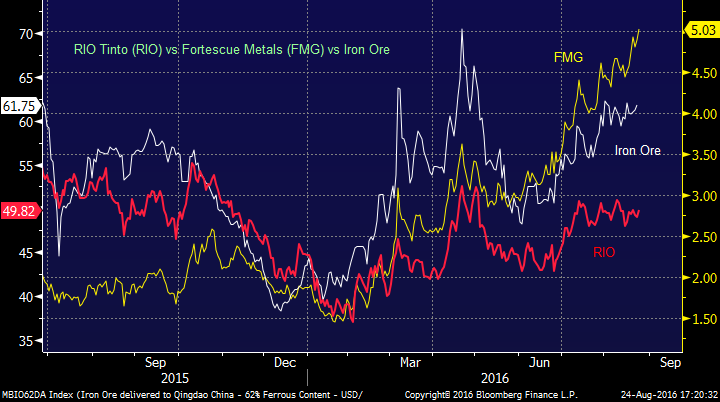
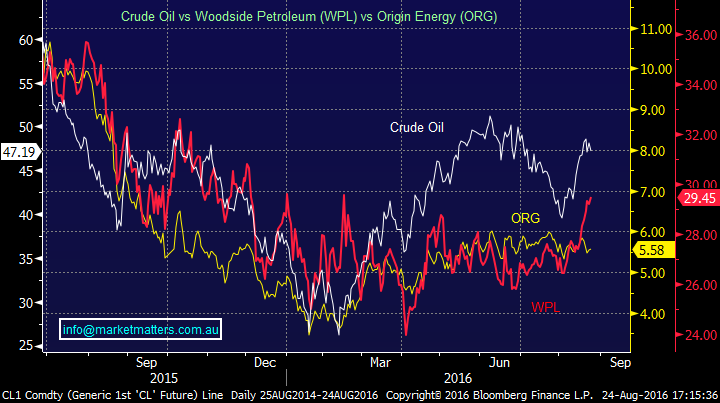
The other interesting aspect of the chart above is the impact of the higher commodity price on the sector. A higher commodity price understandably meant higher share prices for those producers. Oil is interesting at this juncture.
It’s been choppier than Iron Ore (more speculation in theOilmkt) however it’s been tracking higher outpacing the run in the energy producers for some time now. Scepticism of the Oil rally is obvious, yet it’s fairly clear that the positive move in Oil – which we think will continue – should start to translate into higher share prices for energy producers. – which have been basing out for some time now.
Sectors
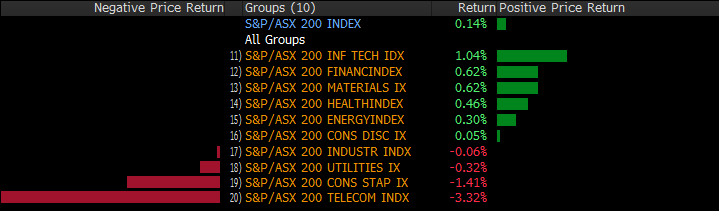
Source; Bloomberg
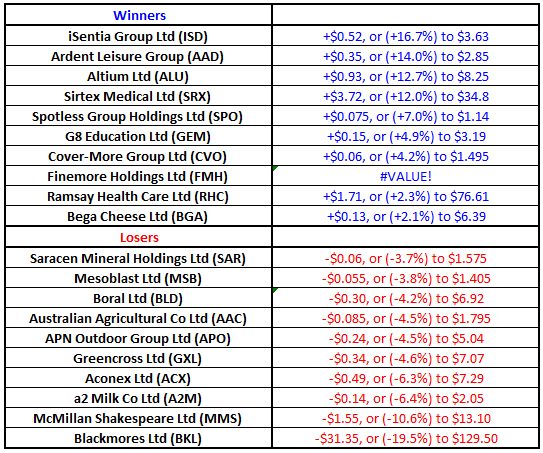
ASX 200 Movers
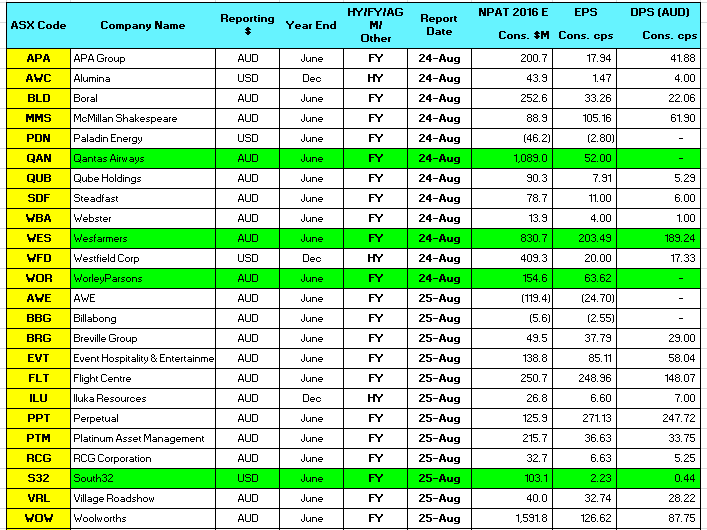
Reporting this week
NPAT = net profit after tax (consensus numbers)
EPS = earnings per share (consensus numbers)
DPS = dividend per share (consensus numbers)
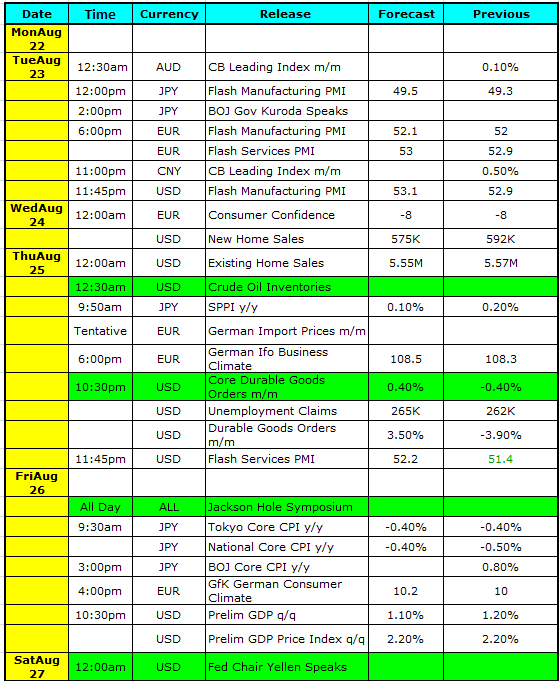
Select Economic Data – This week Stuff that really Matters in Green
No FUTURES data available this evening…
All figures contained from sources believed to be accurate. Market Matters does not make any representation of warranty as to the accuracy of the figures and disclaims any liability resulting from any inaccuracy. Prices as at 24/08/2016. 5:00PM.
Reports and other documents published on this website and email (‘Reports’) are authored by Market Matters and the reports represent the views of Market Matters. The Market Matters Report is based on technical analysis of companies, commodities and the market in general. Technical analysis focuses on interpreting charts and other data to determine what the market sentiment about a particular financial product is, or will be. Unlike fundamental analysis, it does not involve a detailed review of the company’s financial position.
The Reports contain general, as opposed to personal, advice. That means they are prepared for multiple distributions without consideration of your investment objectives, financial situation and needs (‘Personal Circumstances’). Accordingly, any advice given is not a recommendation that a particular course of action is suitable for you and the advice is therefore not to be acted on as investment advice. You must assess whether or not any advice is appropriate for your Personal Circumstances before making any investment decisions. You can either make this assessment yourself or if you require a personal recommendation, you can seek the assistance of a financial adviser. Market Matters or its author(s) accepts no responsibility for any losses or damages resulting from decisions made from or because of information within this publication. Investing and trading in financial products are always risky, so you should do your own research before buying or selling a financial product.
The Reports are published by Market Matters in good faith based on the facts known to it at the time of their preparation and do not purport to contain all relevant information with respect to the financial products to which they relate. Although the Reports are based on information obtained from sources believed to be reliable, Market Matters does not make any representation or warranty that they are accurate, complete or up to date and Market Matters accepts no obligation to correct or update the information or opinions in the Reports.
If you rely on a Report, you do so at your own risk. Any projections are estimates only and may not be realised in the future. Except to the extent that liability under any law cannot be excluded, Market Matters disclaims liability for all loss or damage arising as a result of any opinion, advice, recommendation, representation or information expressly or impliedly published in or in relation to this report notwithstanding any error or omission including negligence.
To unsubscribe. Click Here