You’ve been warned – the Feds’ hawkish
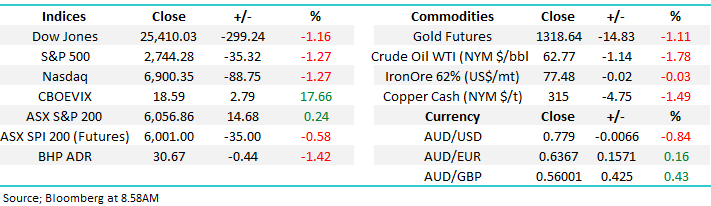
The ASX200 had an average day yesterday gaining only 14-points which probably disappointed most investors following the Dows 400-point surge, however we shouldn’t be too greedy after the strong gains from sub-5800 back on the 9th. What a February it’s been, firstly a 335-point plunge over 5-days followed by a rally of very similar magnitude over the rest of the month - a huge increase in volatility is often the sign that a major market turn is around the corner.
Last night the Dow fell 300-points following hawkish comments by the new Fed Chair Jerome Powell who essentially opened the door to 4 interest rate hikes this year in the US as he acknowledged a strengthening economy and rising inflation may force policy makers to move from the 3 forecasted hikes to 4. Following Powell’s first testimony the market has increased its likelihood of a 4th rate hike in Q4 of 2018 to 50% i.e. toss a coin time however continuing strength in economic data (as has been the case since December) will feed into higher rate expectations – as it should!
Hawkish Terminology = “An aggressive tone. For example, if the Federal Reserve uses hawkish language to describe the threat of inflation, one could reasonably expect stronger actions from the Fed.”
Considering the Dow was up 400-points yesterday and 2440-points over the last 19-days, a 300-point pullback following such aggressive comments from the Fed we believe illustrates the short-term strength of US stocks – the next 24-48 hours will tell if we are too optimistic.
At MM we remain bullish global stocks into March / April targeting fresh 2018 highs and all-time highs from many indices.
However, as we did with Iluka (ILU) yesterday our plan remains to take profit on our holdings as they hit our target areas – we sold ILU taking a ~17% profit in just a couple of weeks increasing our cash position to 9% in the Growth Portfolio.
Today’s report is going to focus on rising interest rates and our evolving opinion of the implications on stocks / sectors – a theme we will also build on in today’s income report
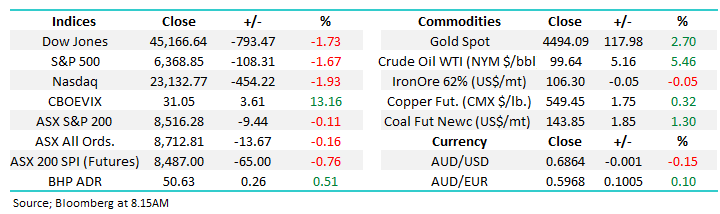
Local Index
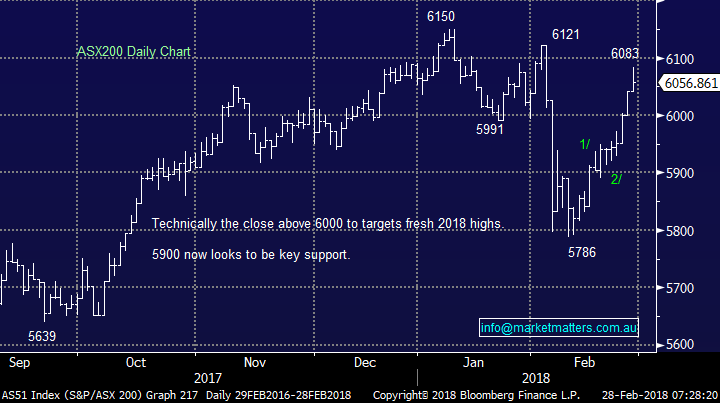
Yesterday the ASX200 closed up +0.2% as it drifted from the lunchtime highs as nervousness set in about the looming Fed testimony – this obviously proved to be well founded. This morning the SPI futures are implying an open ~6025, a few days consolidation as we move from February into March now feels likely particularly given today is the last day of domestic reporting season.
We remain bullish targeting the 6250-6300 area, however a break back under 5900 would force us to question our interpretation.
ASX200 Daily Chart
US interest rates / bond yields.
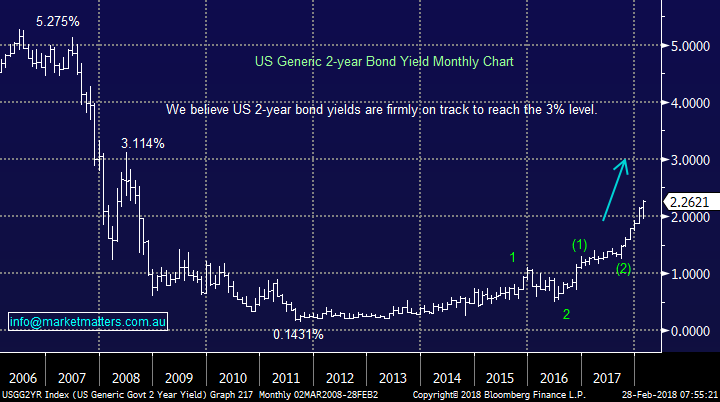
Following the Feds hawkish comments last night we maintain our view that US 2-year bond yields look likely to hit ~3% in 2018/9.
The MM view that global interest rates have bottomed and the multi-decade bear market for interest rates / bull market for bonds is over feels on the money.
US 2-year bond yields Chart
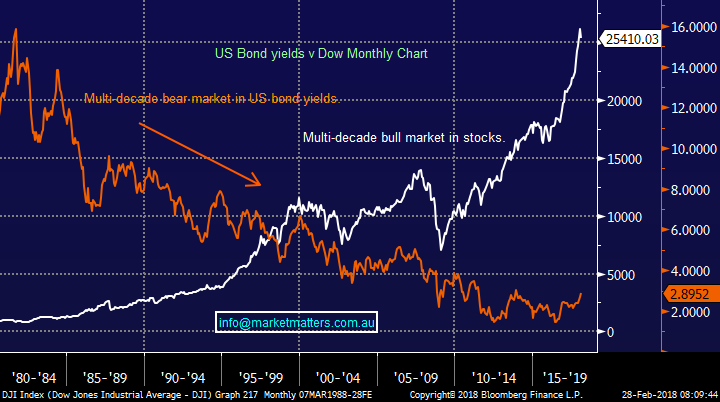
As interest rates rise term deposits become increasingly more attractive than a stock market trading at record highs, we believe there will be an “uncle” point where rising bond yields / interest rates will lead to a significant stock market correction – potentially pretty close to hand.
The correlation between falling interest rates and rising stock prices is clear going back until the early 1980’s when interest rates commenced their almost 40-year decline. Rising interest rates is likely to cause some major speedbumps for stocks at the very least.
US 10-year bond yields v Dow Chart
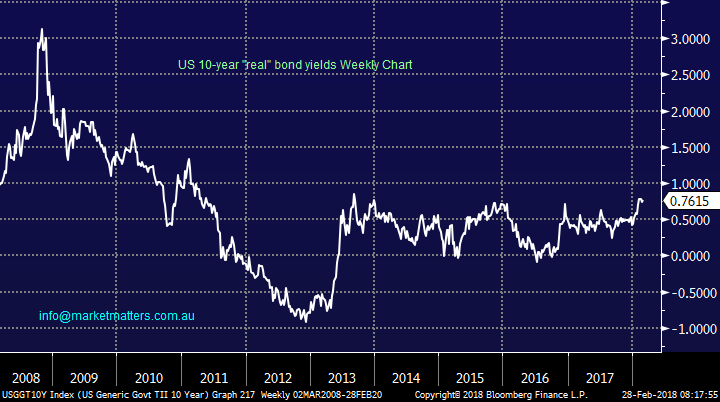
One chart / point that we looked at recently was real US 10-year bond yields i.e. inflation adjusted bonds.
Clearly these have been range bound although in our opinion it’s a matter of time before real bond yields break higher, this could easily be a catalyst to send equities lower hence they remain firmly on our radar.
US 10-year “real” bond yields Chart
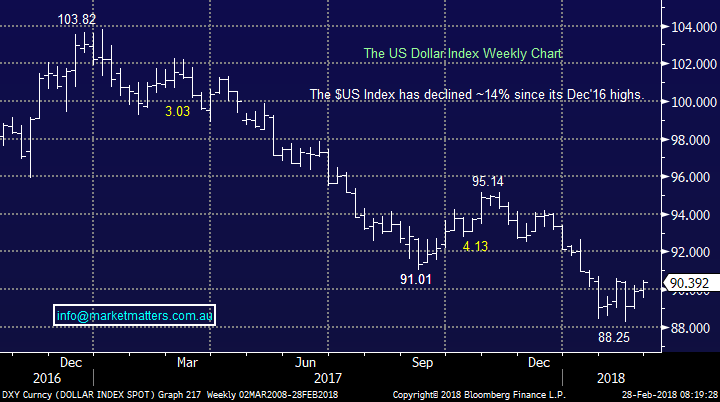
As we have seen over the last week strengthening US bond yields is slowly dragging the $US higher and this should be taken into account when structuring local portfolio’s moving forward i.e. the $A has already fallen from 81.3c to under 78c overnight.
- At this stage our preferred scenario is the $US makes fresh 2018 lows under the 88 level but a rally from current areas would not surprise.
- If / when the $US has a 5-6% rally from a Q1 low as targeted in our outlook piece the resources sector is likely to be a standout underperformer.
- Conversely stocks with $US earnings should outperform.
- Increasing interest rates is bad news for the “yield play” stocks – last night Real estate was the weakest sector in the S&P500.
The $US Dollar Index Chart
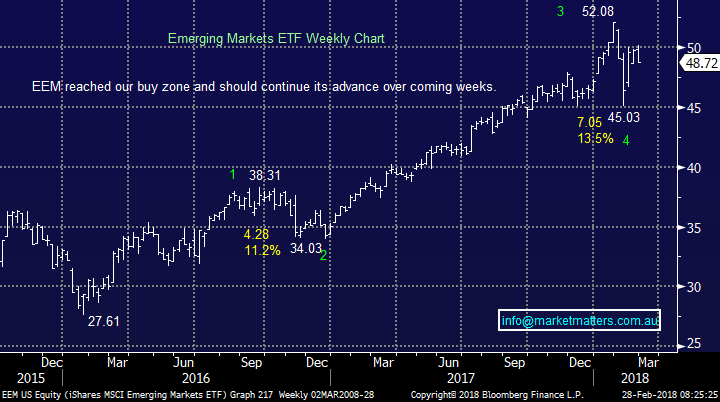
Further consolidation by the Emerging Markets in this current area adds weight to our view that a final pop ~10% higher is a strong possibility in March / April – this adds weight to our preferred scenario that the $US can see one final low in the coming weeks.
The Emerging Markets (EEM) Chart
US Stocks
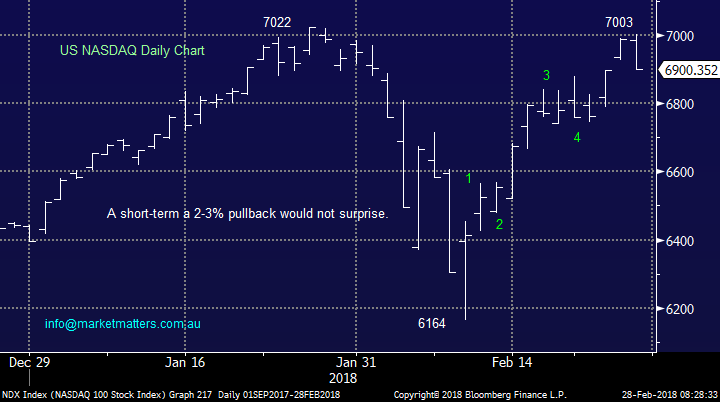
Before the Fed Chairs hawkish statement last night the tech based NASDAQ was trading within 0.27% of its all-time high, strongly suggesting the bull market was still in control.
In the short-term we can easily see a further 2-3% correction following the almost 14% surge from the 9th but we remain bullish for now.
US NASDAQ Chart
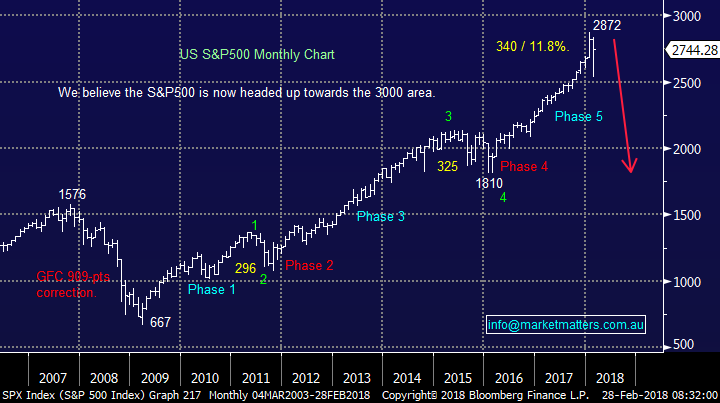
Subscribers must remember our longer-term view that stocks are getting ready for a meaningful +20% correction – a fantastic opportunity for the prepared!
US S&P500 Monthly Chart
Conclusion
- We remain bullish stocks into April / May but be prepared for increasing volatility as market looks for a top.
- We believe bond yields / interest rates will eventually be the undoing of this 9-year bull market.
- We are likely to be sellers of our resources holdings first into March / April e.g. Iluka (ILU) yesterday.
Global Markets
US Indices
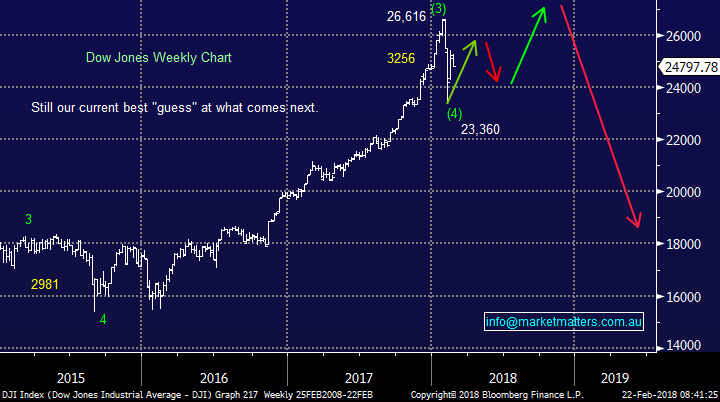
No major change, overall we believe US stocks have formed a low and they will be higher in 1-2 months’ time.
- While we expect US stocks to rally to fresh highs the likely manner of the advance is far more choppy / indecisive than the almost exponential gains we have witnessed from late 2016.
US Dow Jones Chart
European Stocks
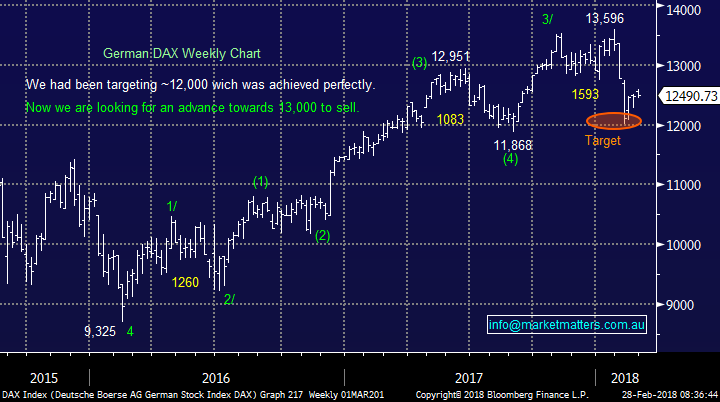
European stocks made fresh recent lows as expected, our preferred scenario is now a rally back over 13,000 by the German DAX to fresh all-time highs in 2018 for an excellent selling opportunity. However, European indices are still struggling to regain any strength and currently feel the “Achilles heel” in our short-term bullish outlook.
German DAX Chart
Asian Stocks
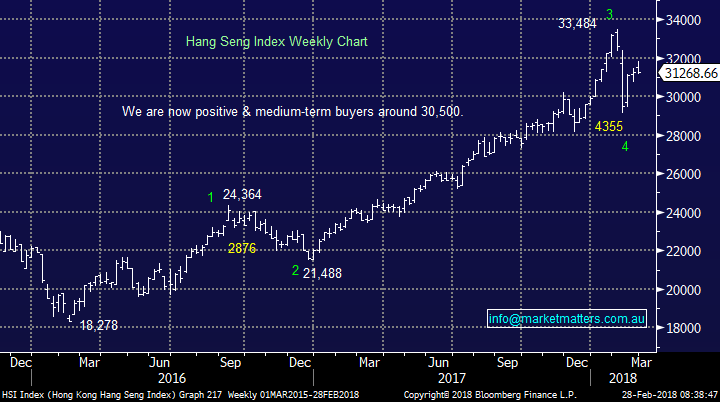
The Hang Seng Index is unfolding as expected and we would be trading buyers ~30,500.
Hang Seng Index Chart
Overnight Market Matters Wrap
· The US major equities markets eased overnight, as investors digested US Fed Chairman, Jerome Powell’s comments that he is leaving the door open for 4 rate hikes this year vs. the consensus of an anticipated 3 hikes.
· With the comments above and consumer confidence higher than expected, the US Treasury yield rose to 2.90%.
· Risk was certainly taken off the table overnight, with all sectors in the red, led by the consumer discretionary and real estate sector.
· BHP is expected to underperform the broader market after ending its US session down and equivalent of 1.42% to $30.67 from Australia’s previous close.
· The March SPI Futures indicating the ASX 200 to open 32 points lower, towards the 6055 area this morning.
Disclosure
Market Matters may hold stocks mentioned in this report. Subscribers can view a full list of holdings on the website by clicking here. Positions are updated each Friday, or after the session when positions are traded.
Disclaimer
All figures contained from sources believed to be accurate. Market Matters does not make any representation of warranty as to the accuracy of the figures and disclaims any liability resulting from any inaccuracy. Prices as at 28/02/2018. 8.58AM
Reports and other documents published on this website and email (‘Reports’) are authored by Market Matters and the reports represent the views of Market Matters. The MarketMatters Report is based on technical analysis of companies, commodities and the market in general. Technical analysis focuses on interpreting charts and other data to determine what the market sentiment about a particular financial product is, or will be. Unlike fundamental analysis, it does not involve a detailed review of the company’s financial position.
The Reports contain general, as opposed to personal, advice. That means they are prepared for multiple distributions without consideration of your investment objectives, financial situation and needs (‘Personal Circumstances’). Accordingly, any advice given is not a recommendation that a particular course of action is suitable for you and the advice is therefore not to be acted on as investment advice. You must assess whether or not any advice is appropriate for your Personal Circumstances before making any investment decisions. You can either make this assessment yourself, or if you require a personal recommendation, you can seek the assistance of a financial advisor. Market Matters or its author(s) accepts no responsibility for any losses or damages resulting from decisions made from or because of information within this publication. Investing and trading in financial products are always risky, so you should do your own research before buying or selling a financial product.
The Reports are published by Market Matters in good faith based on the facts known to it at the time of their preparation and do not purport to contain all relevant information with respect to the financial products to which they relate. Although the Reports are based on information obtained from sources believed to be reliable, Market Matters does not make any representation or warranty that they are accurate, complete or up to date and Market Matters accepts no obligation to correct or update the information or opinions in the Reports.
If you rely on a Report, you do so at your own risk. Any projections are estimates only and may not be realised in the future. Except to the extent that liability under any law cannot be excluded, Market Matters disclaims liability for all loss or damage arising as a result of any opinion, advice, recommendation, representation or information expressly or impliedly published in or in relation to this report notwithstanding any error or omission including negligence.
To unsubscribe. Click Here