Will our resources ever play catch up with the booming Emerging Markets?
We continue to believe there is a far greater than 50% chance that we have commenced an inflection week with our ideal target for the ASX200 around the 6000 level - this of course will significantly be influenced by the markets interpretation of today's report by ANZ. Statistically if we are going to experience a classic "sell in May and go away" seasonal correction there is a strong possibility that the May top will be this week, especially when we consider the market sensitive events unfolding over the coming days which include ANZ and NAB results, a large Macquarie conference today which has a lot of the market speaking and importantly this event has a history of moving stocks, the FOMC announce their decision on US interest rates on Wednesday, Friday sees the US employment Non-Farm Payrolls data and on the 7th we have the French elections.
Remember the "DOT Theory" - 80% of the time the high, or low, of any time frame will be formed in the first 20% of the respective timeframe.
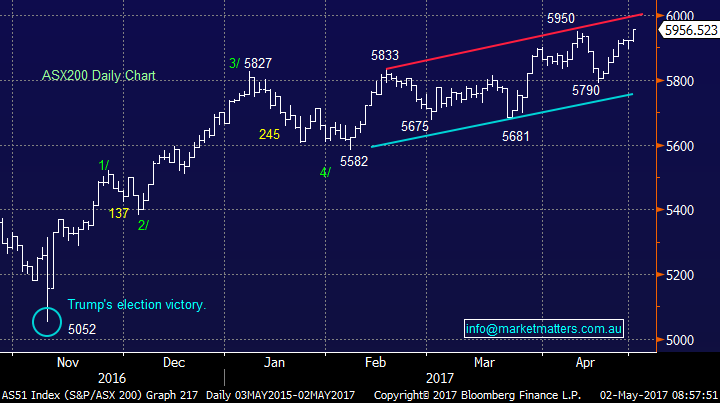
The ASX200 has now advanced 904-points / 17.9% since Donald Trump's dramatic election victory almost exactly 100-days ago. The average correction over the May / June period since the current bull market commenced in March 2009 has been 6.9% which would bring the local market back towards the 5600 area. This degree of pullback to where the market was in early February would represent around a 40% correction of the advance since November, this all sounds reasonable and actually healthy for a bull market, albeit in our opinion a very mature one.
ASX200 Daily Chart
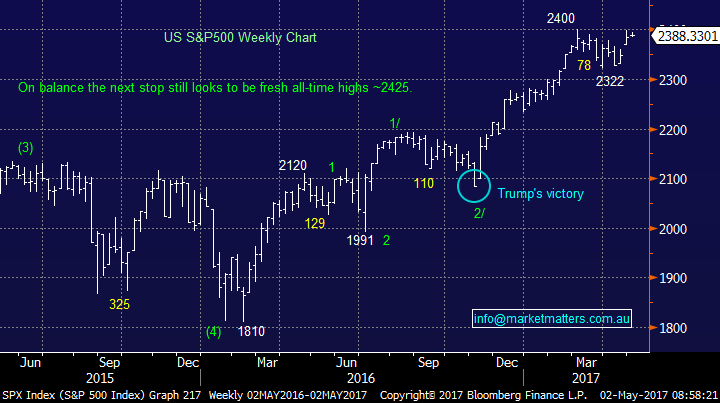
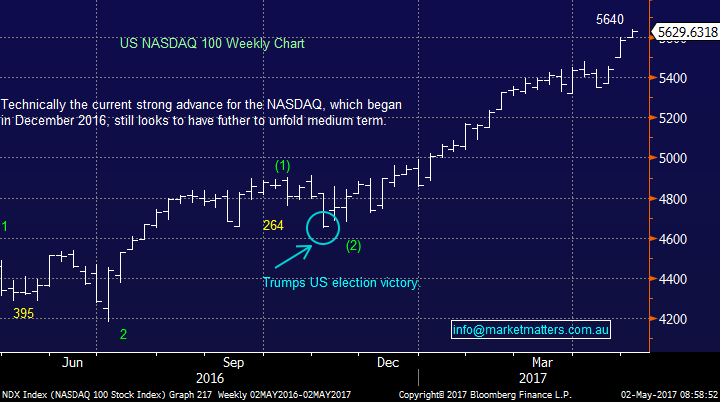
This morning US stocks have again closed basically unchanged with the exception of the NASDAQ which yet again powered to fresh all-time highs, gaining another +0.8%. Importantly US equities remain extremely close to our initial upside target and risk / reward no longer favours general buying:
1. The US S&P500 remains poised to only rally another ~1.5% over next few days / weeks.
2. A 5% correction is still looming rapidly on the horizon, it still feels like we are heading towards a classic "sell in May and go away" scenario.
3. Assuming we get a 5% correction over May / June, similar to last year, we will be keen buyers into this weakness targeting further gains later in 2017. The NASDAQ is likely to be our yardstick for a buy area with US stocks and we will be simply looking for a correction of ~265-points, similar to that in October / November 2016.
US S&P500 Weekly Chart
US NASDAQ Weekly Chart
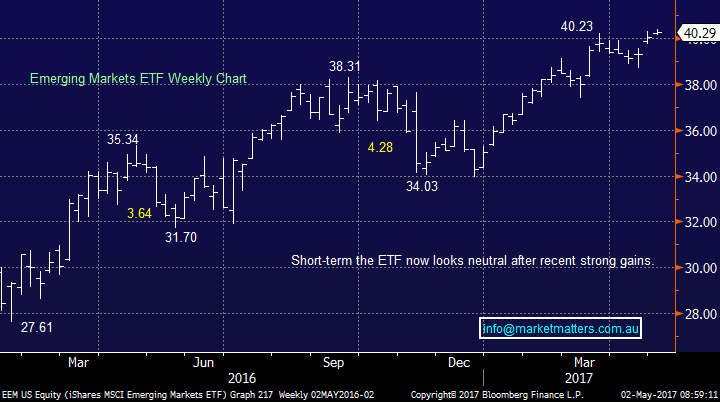
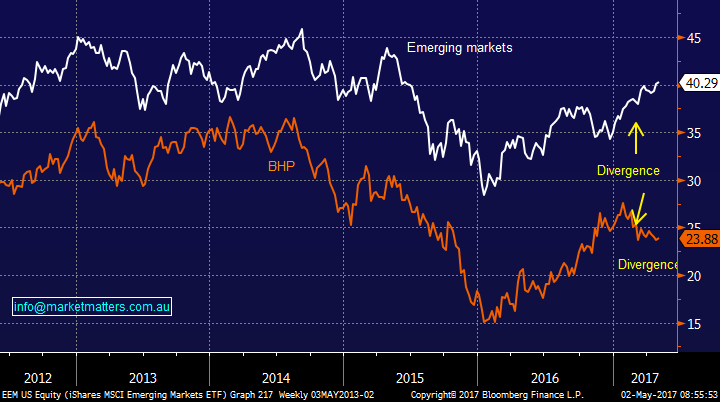
Last week investors put almost $1bn to work in Emerging Markets ETF's (stocks and bonds) making it 8-straight weeks of gains, yet over the same period local resource stocks have tumbled. After yesterday’s mild weakness the simple numbers for 2017 are not exciting reading for Australian investors, the Emerging Markets MSCI ETF (EEM) has now rallied +15% yet BHP is down -4.7%, while RIO is only marginally lower for 2017 it has fallen over 14% from its high earlier in the year. As we illustrated in the Weekend Report there is usually a high degree of correlation between our resources sector and the EEM but currently clear divergence has been unfolding since late January with our resource stocks falling while the EEM continues to advance. The question is - do we remain comfortable with our recent foray into the resources sector which are currently showing small paper losses?
Emerging Markets ETF Weekly Chart
Emerging Markets (EEM) v BHP Weekly Chart
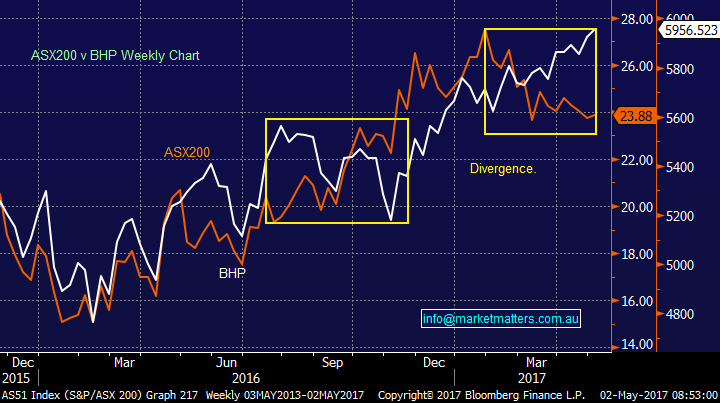
We are also currently witnessing significant divergence between the ASX200 and again say BHP, in other words our broad market is following the EEM higher while the resources remain weak. However a similar degree of divergence unfolded in 2016 when the ASX200 experienced a decent correction but BHP rallied. This is reassuring to find considering we believe there is strong possibility of a May / June correction in the broad local market.
ASX200 v BHP Billiton (BHP) Weekly Chart
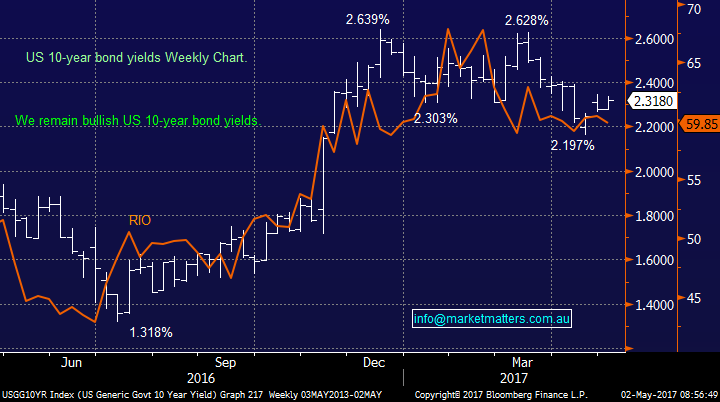
Both copper and iron ore have enjoyed decent bounces over recent trading sessions, with advances from their respective lows of 6% and 9%. While this has not been enough to-date to convince investors that the correction in resources is complete a little more strength we believe will tip the balance and send resources stocks sharply higher. Lastly, we thought this would be an opportune time to take a look at the recent relationship between US bond yields and say RIO.
It's has been our view at MM that US 10-year bond yields will rise over coming months, leading to 2 likely outcomes:
1. The US banking sector will recover from their recent losses which our local banks ignored.
2. Gold stocks should continue their correction, hence we remain "fussy" with our re-entry target back into Regis Resources (RRL).
The correlation between the US 10-year bond yield and RIO over the last year has year has been excellent. Hence if we are correct with our macro call of US bond yields to make fresh highs for 2017 in coming months there exists a strong possibility that RIO will regain its "mojo" very soon.
US 10-year bond yields v RIO Tinto (RIO) Weekly Chart
Conclusion(s)
The main conclusions for today:
1. We remain bullish the resources sector from current levels, particularly while US 10-year bond yields remain positioned to rally.
2. We remain keen to buy RRL into weakness but our initial buy zone is under $3.05 i.e. over 5% below yesterday's close.
3. Our favourite trade at this point in time is to sell the currently popular banks and buy resources - that's contrarian stuff!
Overnight Market Matters Wrap
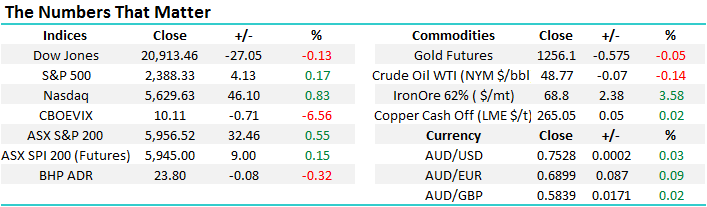
· The US major share indices closed with little change, except for the NASDAQ 100, rallying up 0.83%.
· Oil underperformed and slid over 1% overnight, while Iron Ore continues its recent outperformance, up 3.58%.
· The June SPI Futures is indicating the ASX 200 to open 14 points higher, towards the 5970 level this morning.
Disclosure
Market Matters may hold stocks mentioned in this report. Subscribers can view a full list of holdings on the website by clicking here. Positions are updated each Friday.
Disclaimer
All figures contained from sources believed to be accurate. Market Matters does not make any representation of warranty as to the accuracy of the figures and disclaims any liability resulting from any inaccuracy. Prices as at 02/05/2017. 8.50AM.
Reports and other documents published on this website and email (‘Reports’) are authored by Market Matters and the reports represent the views of Market Matters. The MarketMatters Report is based on technical analysis of companies, commodities and the market in general. Technical analysis focuses on interpreting charts and other data to determine what the market sentiment about a particular financial product is, or will be. Unlike fundamental analysis, it does not involve a detailed review of the company’s financial position.
The Reports contain general, as opposed to personal, advice. That means they are prepared for multiple distributions without consideration of your investment objectives, financial situation and needs (‘Personal Circumstances’). Accordingly, any advice given is not a recommendation that a particular course of action is suitable for you and the advice is therefore not to be acted on as investment advice. You must assess whether or not any advice is appropriate for your Personal Circumstances before making any investment decisions. You can either make this assessment yourself, or if you require a personal recommendation, you can seek the assistance of a financial advisor. Market Matters or its author(s) accepts no responsibility for any losses or damages resulting from decisions made from or because of information within this publication. Investing and trading in financial products are always risky, so you should do your own research before buying or selling a financial product.
The Reports are published by Market Matters in good faith based on the facts known to it at the time of their preparation and do not purport to contain all relevant information with respect to the financial products to which they relate. Although the Reports are based on information obtained from sources believed to be reliable, Market Matters does not make any representation or warranty that they are accurate, complete or up to date and Market Matters accepts no obligation to correct or update the information or opinions in the Reports.
If you rely on a Report, you do so at your own risk. Any projections are estimates only and may not be realised in the future. Except to the extent that liability under any law cannot be excluded, Market Matters disclaims liability for all loss or damage arising as a result of any opinion, advice, recommendation, representation or information expressly or impliedly published in or in relation to this report notwithstanding any error or omission including negligence.
To unsubscribe. Click Here


