Will our Fund Managers follow the bullish signs from the NASDAQ?
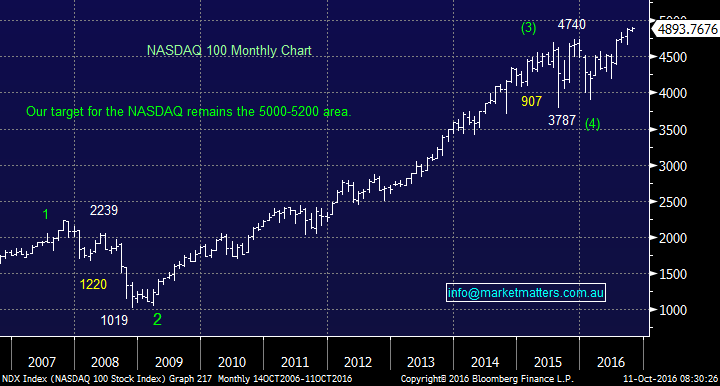
After a bad few days for Donald Trump, equities, the Mexican Peso and commodities all rallied last night. What caught our eye was the US Tech Index, the NASDAQ, which made fresh all-time highs - we have to reiterate it feels premature to be getting hyper-bearish on stocks despite the continuing negativity about valuations / earnings etc. The NASDAQ is very often the leading index for US stocks and our ideal target remains 5-6% higher. Also last night the Russians implied they would join OPEC in capping production thus supporting the oil price leading to an almost 3% rally in crude oil which should rally our energy sector up nicely today.
With markets defying the many negative pundits we thought it was an ideal time to again look at 3 of our best performing local fund managers over the last 12-months, to see if any opportunities are emerging.
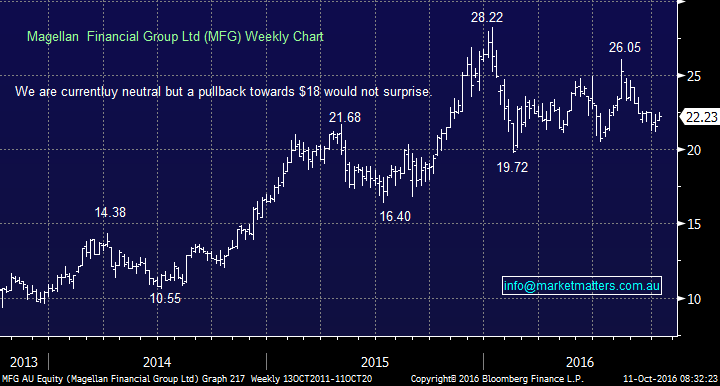
1. Magellan Financial Group (MFG) $22.23 - Est. 2017 P/E of 19.5x and yields 4% fully franked.
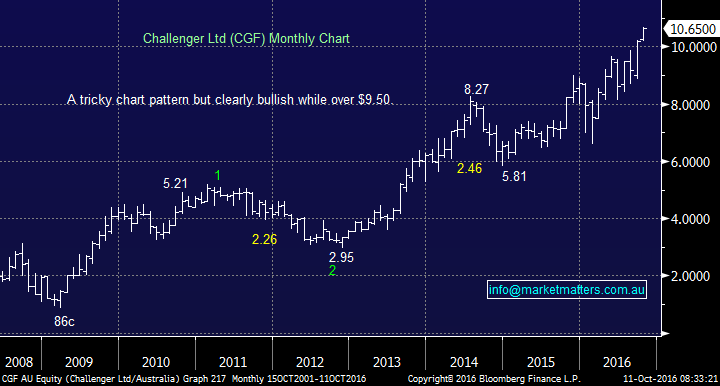
2. Challenger (CGF) $10.65 - Est. P/E of 16.2X and yields 3% fully franked.
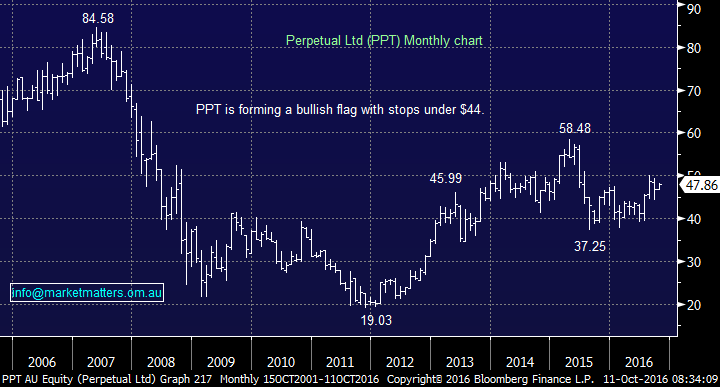
3. Perpetual Ltd (PPT) $47.86 - Est. P/E of 17.2x and yields 5.3% fully franked.
Noticeably all 3 of these stocks have outperformed the market over the last 12-months, led by CGF, but as we have seen with the REIT's and Telco's that is no guarantee of the future. One thing that is clear from the simple snapshot of valuations is the sector is not particularly expensive and it pays nice fully franked dividends. Fund management businesses are very leveraged to the fate of the overall market and will typically outperform in times when markets are moving higher and underperform when markets move lower. When markets are rising, funds under management increase and normally we see positive fund flow, so they get the upswing from the market plus new money. The reverse typically happens in a weak market which all but guarantees underperformance. Assuming the market continues higher for the remainder of the year – which is our view – then fund managers as a group should outperform, however, if trading these stocks, stay close to the door as they’ll be sold aggressively if the market rolls over in 2017.
US NASDAQ Monthly Chart
Magellan Financial Group (MFG) $22.23
MFG was the big performer in the sector between 2014 and early 2016 but this year things have clearly turned sour with a 30% correction in the first two months of the year. Simply the stock was rerated after earnings levelled off in 2016 with EPS growth of just +4% while this will level out ever further in FY17 with flat earnings - yet it still trades on a P/E higher than its peers. Unfortunately, in 2016 the stock has failed to deliver returns to investors despite its exposure to the outperforming US stock market.
Technically MFG is generating no buy signals after its decent correction and we have to remain neutral the stock at this point.
Magellan Financial Group (MFG) Weekly Chart
Challenger (CGF) $10.65
CGF has a dominant market position in the very popular annuity business which is being supported by an aging demographic, poor returns generally from other assets and regulatory tailwinds – which could really turn to dial for CGF if legislation is implemented to further promote annuities. (For instance, the Govt could legislate the amount of annuity style investments super funds need to hold to support their members retirement). Furthermore, there’s not a lot of competition in this space, and it’s unlikely that we’ll see banks enter the fray given the high capital requirements placed on annuity providers. It would take some decisive move by Govt to change this in our view.
While we feel it will correct aggressively when the market tops out, and particularly if we see big movements in bond markets, we do not believe that will occur until 2017.
Technically CGF looks bullish as it makes multi-year highs, we could be long with stops under $9.50.
Challenger (CGF) Monthly Chart
Perpetual Ltd (PPT) $47.86
PPT has been relatively quiet since its strong correction back in mid-2015 but it feels it could be time for a decent move after 12-months consolidation. If it can hold over $44 we are targeting +$55. If we compare to Magellan, PPT is expected to have earnings growth of +5.9% in FY17, compared to flat earnings growth by MFG, plus it trades at an 11% discount. It’s a high-quality business and although it's more mature than MFG – and probably has less swing factors that could turn the dial on earnings, we think current valuation + technical setup looks more appealing.
Technically PPT is looking positive medium term as a classic bullish flag forms, very similar to the formation that led to the successful trade in RIO recently. We can be buyers here with stops under $44.
Perpetual Ltd (PPT) Monthly Chart
Summary
- We like CGF and PPT but are neutral on MFG
- Currently, we prefer banks with their strong seasonality and dividends looming but we are fully exposed in this sector at present and fund managers do give good quasi-exposure to the index, unfortunately, neither CGF or PPT trade ex-dividend this calendar year.
Overnight Market Matters Wrap
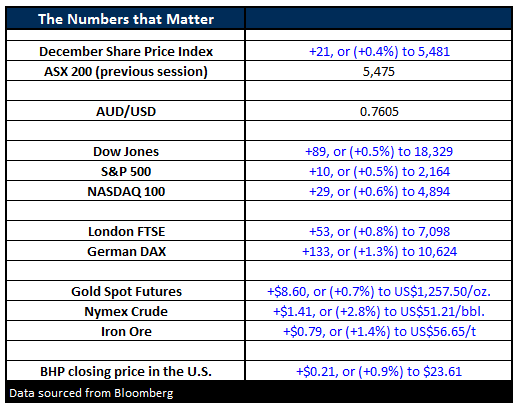
- Stocks closed higher last night, led yet again by oil. The Dow closed up 88 points (+0.5%) to 18,329 and the S&P500 finished the day up 10 points (0.5%) to 2,163.
- Russia surprised the market by announcing that they are willing to join OPEC in cutting oil output. Crude finished up US$1.41 (+2.8%) to US$51.21/bbl.
- Gold was stronger, putting on US$8.60 (+0.7%) to US$1,257.50/oz, after having the worst week since last November. A weaker US payrolls figure last Friday swayed the market to believe that the US was less likely to raise rates in December. That, together with the Chinese buyers returning from their Golden Week holiday.
- Iron Ore put in a welcome appearance after the week-long holiday, rising 70c (+1.4%) to US$56.65/t.
- The December SPI Futures is indicating the ASX 200 to open up 21 points higher this morning, testing the 5,500 level.
If you rely on a Report, you do so at your own risk. Any projections are estimates only and may not be realised in the future. Except to the extent that liability under any law cannot be excluded, Market Matters disclaims liability for all loss or damage arising as a result of any opinion, advice, recommendation, representation or information expressly or impliedly published in or in relation to this report not
The Reports are published by Market Matters in good faith based on the facts known to it at the time of their preparation and do not purport to contain all relevant information with respect to the financial products to which they relate. Although the Reports are based on information obtained from sources believed to be reliable, Market Matters does not make any representation or warranty that they are accurate, complete or up to date and Market Matters accepts no obligation to correct or update the information or opinions in the Reports.
The Reports contain general, as opposed to personal, advice. That means they are prepared for multiple distributions without consideration of your investment objectives, financial situation and needs (‘Personal Circumstances’). Accordingly, any advice given is not a recommendation that a particular course of action is suitable for you and the advice is therefore not to be acted on as investment advice. You must assess whether or not any advice is appropriate for your Personal Circumstances before making any investment decisions. You can either make this assessment yourself or if you require a personal recommendation, you can seek the assistance of a financial adviser. Market Matters or its author(s) accepts no responsibility for any losses or damages resulting from decisions made from or because of information within this publication. Investing and trading in financial products are always risky, so you should do your own research before buying or selling a financial product.
Reports and other documents published on this website and email (‘Reports’) are authored by Market Matters and the reports represent the views of Market Matters. The Market Matters Report is based on technical analysis of companies, commodities and the market in general. Technical analysis focuses on interpreting charts and other data to determine what the market sentiment about a particular financial product is, or will be. Unlike fundamental analysis, it does not involve a detailed review of the company’s financial position.
All figures contained from sources believed to be accurate. Market Matters does not make any representation of warranty as to the accuracy of the figures and disclaims any liability resulting from any inaccuracy. Prices as at 11/10/2016. 9:00AM.with standing any error or omission including negligence.
To unsubscribe.Click Here