Where is tax loss selling most likely to hit?
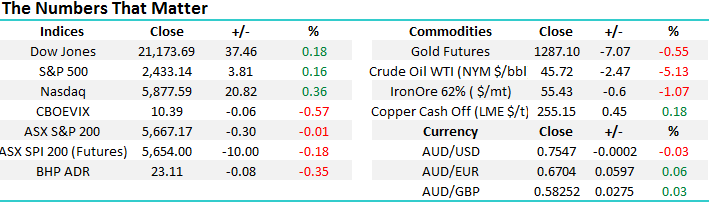
The ASX200 finally found some love yesterday following the GDP data which showed Australia’s economic growth was slightly better than many feared coming in at +0.3%. Importantly we didn’t receive the negative print that some economists were forecasting which could have led us towards a technical recession. Amazingly Australia, along with Poland and South Korea remains the only countries in the industrialized world to avoid a recession courtesy of the GFC. The relief was especially evident with the $A which rallied 0.5c to 75.5c immediately following news.
Our view is the Australian economy should muddle along ok unless the much discussed property prices do correct too savagely. The psychological effect on the Australian consumer of their main asset falling in price we feel would lead to an ongoing tightening of the purse strings and hence a likely recession.
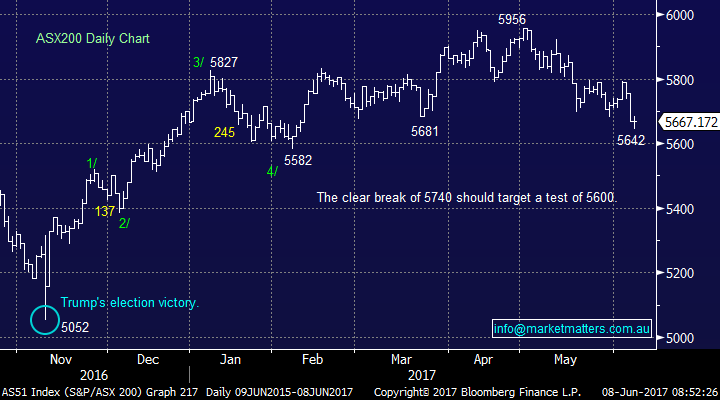
The ASX200 has now corrected 311-points (5.2%) from its 2017 high on the 1st of May. Following yesterday’s price action we have again tweaked the 3 index levels where we feel it becomes logical to commence accumulating further stock i.e. 5600, 5550 and 5500. Note, individual stocks may clearly give good entry levels before the index reaches these targets, we simply use them a guide. Currently, the Market Matters portfolio sits in 10% cash, whilst we hold 15 individual stocks, a number that is high for us given we generally run a more concentrated approach. If we look back, at the start of May we held 11 stocks and ~30% cash and have been clear buyers into weakness.
ASX200 Daily Chart
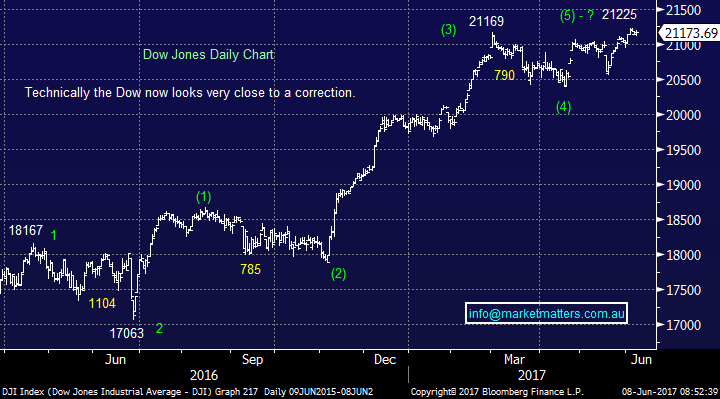
US stocks drifted marginally higher last night with the Dow closing 0.8% above the level where we see a technical sell signal being generated i.e. if the Dow closes back under 21,000. We still believe a 4-5% correction is close at hand for US stocks following its impressive rally since the US election.
US Dow Jones Daily Chart
As we consider different areas to allocate funds into the current market weakness potential tax loss selling should definitely be considered as June slowly evolves. The ASX200 is up almost 6% for the calendar year hence there will not be the number of candidates which would typically be available in a down year. However if an investor is considering buying a stock which is well in the red this financial year patience maybe be rewarded as it’s a candidate for selling in the coming 1-2 weeks. Buying stocks which are being sold for tax reasons can often give optimum entry given the selling is not a direct result of poor performance by the company itself.
There are 16 ASX200 stocks that are currently down by over 10% this year:
CYBG PLC (CYB), Brambles (BXB), Star Entertainment (SGR), Navitas (NVT), Domino’s Pizza (DMP), Janus Henderson (HGG), Santos (STO), Healthscope (HSO), Medibank Private (MPL), Westfield Corp (WFD), Vicinity Centre (VCX), Harvey Norman (HVN), Carsales.com (CAR), Vocus (VOC), TPG Telecom (TPM) and Telstra (TLS).
We actually own 3 of these stocks but fortunately from good levels. It has not gone unnoticed at our end that one of these 3 holdings is already underperforming the ASX200 over the last 5-days i.e. ASX200 -1% whereas CYB -1.5%, TLS +1.3% and HGG +1.9%. The first question to ask ourselves is do we want to increase any of these 3 holdings if weakness does unfold in coming 1-2 weeks.
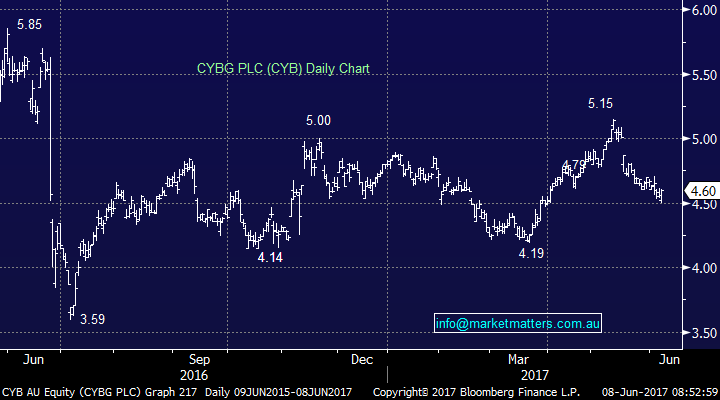
TLS is not far from our $4.60 sell area so that’s clearly not a candidate. HGG has recently tested our $44 initial target area making us more of a seller than a buyer although we are giving the holding a little room at present. CYB is a stock we still like at current levels although it may experience some significant volatility this week with both the ECB announcement (don’t expected any change to policy, but they may drop the reference to ‘downside’ risks to growth) and the UK election tonight. We will consider averaging CYB around $4.25 if it falls on selling that we perceive to be tax loss selling not negative news out of Europe.
CYBG PLC Daily Chart
Once we take out the sectors and stocks that we simply don’t like the condensed list is very short, only HSO and DMP.
HSO is a stock that we have been watching for a while, pretty much since we took profit on our holding over $2.30 in February. With the stock now ~10% lower our attention has certainly been twigged. Previously we have written that we may consider HSO closer to the $2 region if tax loss selling eventuates, however we continue to see some risk around earnings. Earnings trends that are shown in the chart below are obviously weak, and trending down. (red line is estimated earnings per share)
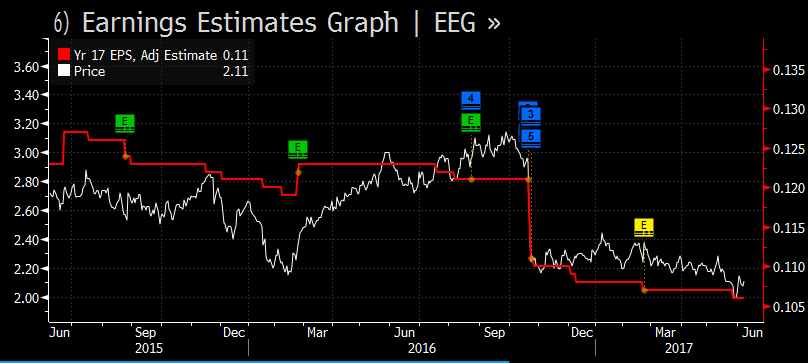
Source; Bloomberg
That in itself is not necessarily a major issue if the market has factored / priced in that trend, however in the context of HSO, consensus expectations get more bullish from 2018 onwards with a gradual rise in earnings per share from 10.5cps in 2017 to 16.25cps by 2020 – which is pretty optimistic in our view and creates some obvious risk of disappointment.
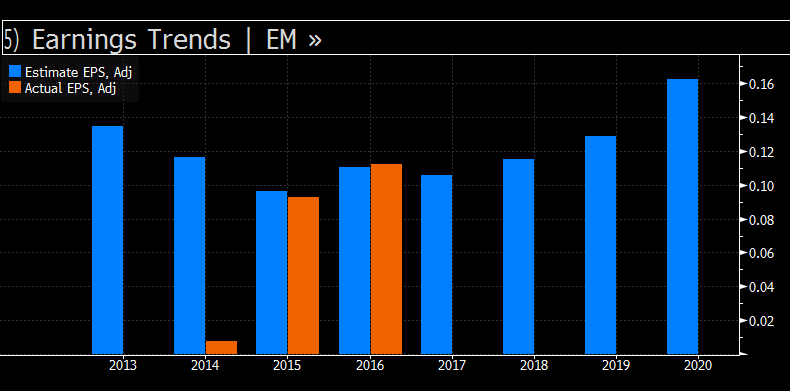
Source; Bloomberg
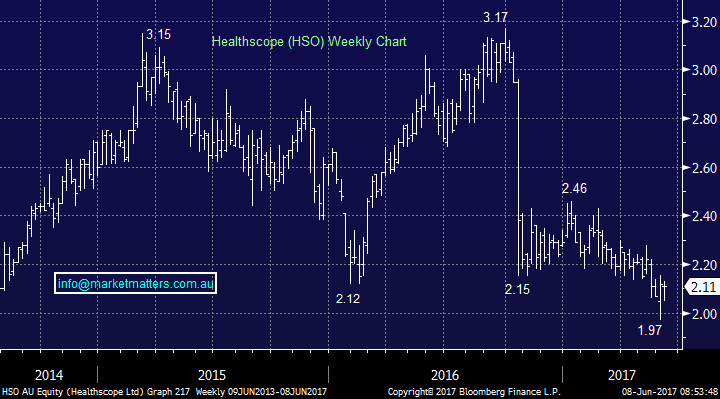
This looks a reasonable ‘technical trade’ if taken at lower levels however it would certainly be one to only give a relatively small amount of room to.
Healthscope (HSO) Weekly Chart
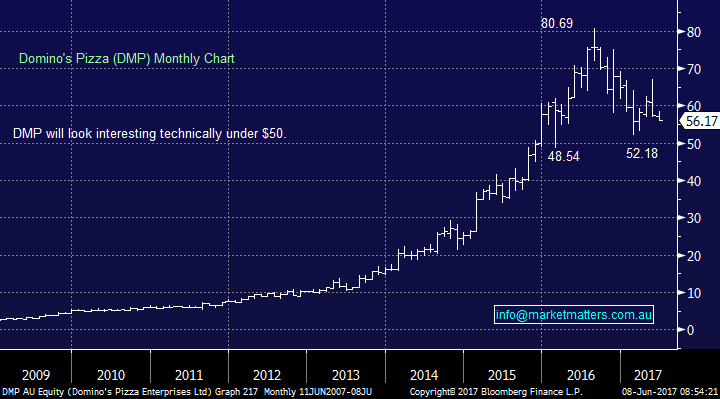
DMP is a stock we have not been involved with over recent years, the volatility clearly puts it in the aggressive basket and frankly, we’ve viewed the stock as exceptionally expensive and a crowded trade full of ‘tip sheet monkeys’. DMP is now trading on a valuation of 41x earnings as the market continues to price the company for strong growth however the recent 30% correction has tamed down the crazy valuations of mid-2016. That said, it’s still hard to argue in favour of this stock on fundamental metrics without a good pair of rose coloured glasses on.
Technically we could buy DMP under $50 with clear stops under $40 – this feels more like a trade than an investment.
Domino’s Pizza (DMP) Monthly Chart
Conclusion (s)
We cannot see enormous opportunities unfolding courtesy of tax loss selling but we like CYB ~$4.25, while HSO ~$2 and DMP under $50 look reasonable ‘technical’ trades.
Overnight Market Matters Wrap
· The US recovered some of its current week’s gains overnight, ending its session marginally higher, however most global investors wait for the outcome of the UK election today and ECB policy decision to determine their investments.
· Oil plumbed almost 5% overnight on concerns once again of oversupply as the latest crude stockpile figures rose unexpectedly. The weekly numbers rose over 3 m barrels after falling for the last 8 weeks.
· A marginal weak open is expected in the ASX 200 this morning, towards the 5650 area as indicated by the June SPI Futures.
Disclosure
Market Matters may hold stocks mentioned in this report. Subscribers can view a full list of holdings on the website by clicking here. Positions are updated each Friday.
Disclaimer
All figures contained from sources believed to be accurate. Market Matters does not make any representation of warranty as to the accuracy of the figures and disclaims any liability resulting from any inaccuracy. Prices as at 08/06/2017. 8.00AM.
Reports and other documents published on this website and email (‘Reports’) are authored by Market Matters and the reports represent the views of Market Matters. The MarketMatters Report is based on technical analysis of companies, commodities and the market in general. Technical analysis focuses on interpreting charts and other data to determine what the market sentiment about a particular financial product is, or will be. Unlike fundamental analysis, it does not involve a detailed review of the company’s financial position.
The Reports contain general, as opposed to personal, advice. That means they are prepared for multiple distributions without consideration of your investment objectives, financial situation and needs (‘Personal Circumstances’). Accordingly, any advice given is not a recommendation that a particular course of action is suitable for you and the advice is therefore not to be acted on as investment advice. You must assess whether or not any advice is appropriate for your Personal Circumstances before making any investment decisions. You can either make this assessment yourself, or if you require a personal recommendation, you can seek the assistance of a financial advisor. Market Matters or its author(s) accepts no responsibility for any losses or damages resulting from decisions made from or because of information within this publication. Investing and trading in financial products are always risky, so you should do your own research before buying or selling a financial product.
The Reports are published by Market Matters in good faith based on the facts known to it at the time of their preparation and do not purport to contain all relevant information with respect to the financial products to which they relate. Although the Reports are based on information obtained from sources believed to be reliable, Market Matters does not make any representation or warranty that they are accurate, complete or up to date and Market Matters accepts no obligation to correct or update the information or opinions in the Reports.
If you rely on a Report, you do so at your own risk. Any projections are estimates only and may not be realised in the future. Except to the extent that liability under any law cannot be excluded, Market Matters disclaims liability for all loss or damage arising as a result of any opinion, advice, recommendation, representation or information expressly or impliedly published in or in relation to this report notwithstanding any error or omission including negligence.
To unsubscribe. Click Here


