Were dusting off the sellers hat
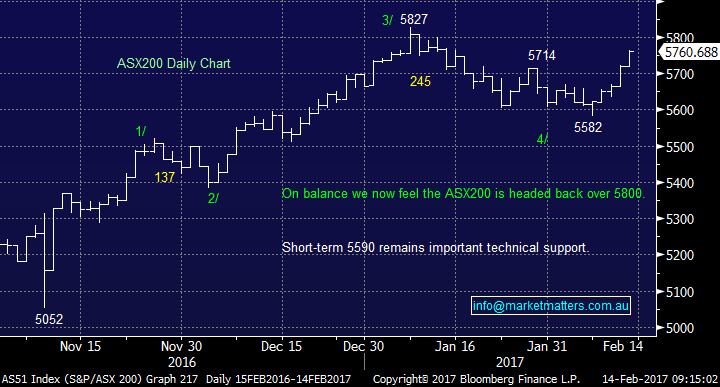
Global equities continue to rally nicely in this seasonally bullish period for stocks, which historically does not end until the end of April. Our mantra for 2017 remains "buy weakness and sell strength" and as the ASX200 approaches the 5800 area the MM buyers hat that was worn down around 5600 area has gone and looks soon to be replaced with its opposite friend. Our belief remains that at least the first half of this year will be a choppy ascent for markets yielding some good opportunities for the nimble e.g. we have already experienced a 4.2% correction followed by a recovery of nearly all of these losses and we're only 6-weeks into the year. We continue to believe that this current stock market strength is being fuelled by fund managers who have found themselves underweight stocks in a rising market, the strong performance over the last 5-days by underperforming stocks illustrates this view perfectly e.g. TPG Telecom +9.7% and Sydney Airports +6.1%.
Importantly any selling is likely to be focused in stocks that have a relatively strong correlation to the overall index i.e. high beta. At this stage the current strong bullish momentum targets another ~1.5% of gains hence we are just exploring any selling options at present, as opposed to anticipating immediately pulling the trigger. Also, as we still think the market goes higher through the majority of 2017 we must believe better buying opportunities will present themselves to warrant any overall market exposure reduction.
NB. As we are in the centre of the volatile reporting season for individual stocks we may get some buying opportunities provided by any negative over reactions e.g. Ansell who we like ~$21 popped under this level yesterday for literally a few minutes - one to keep an eye on. Statistically buying stocks after a poor report is not a good risk / scenario as the underperformance can take around 6-months to wash out but there are always exceptions to every rule.
ASX200 Daily Chart
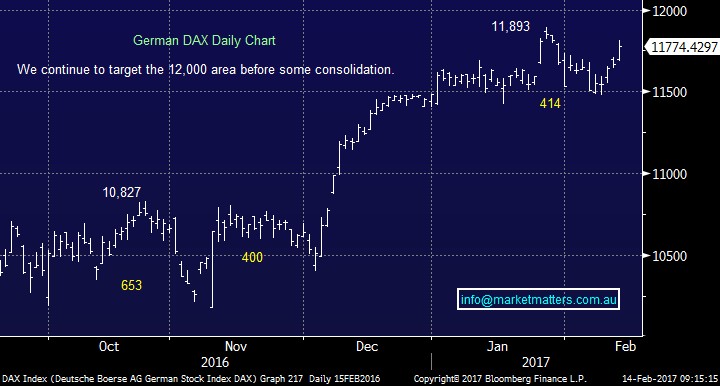
We have been focusing on the German DAX over recent weeks as its short-term path has been the clearest to us at MM among the major global indices. We continue to target the 12,000 area prior to a pullback and this is now only 1.9% higher which coincides nicely with our view for the local market i.e. slightly higher before another pullback.
German DAX Daily Chart
A number of subscribers often ask us why we look at both fundamental and technical analysis and the simple, almost flippant sounding answer, is why not use all the tools at your disposal.
- Fundamental analysis gives an investor an insight into the company's current performance leaving us to extrapolate this into the future potential for the stock. However we can only see what the directors allow us to view and unfortunately the recent number of share price collapses that was preceded by directors selling their own shares is very concerning - never underestimate human emotions, including greed.
- Technical Analysis simply allows the investor to monitor the flow of money which importantly includes all the players with potentially more knowledge than yourself. Almost all successful fund / hedge managers use technical analysis whether to manage risk, initiate trades or simply follow trends hence we believe it makes no sense not to use this widely accepted tool when appropriate.
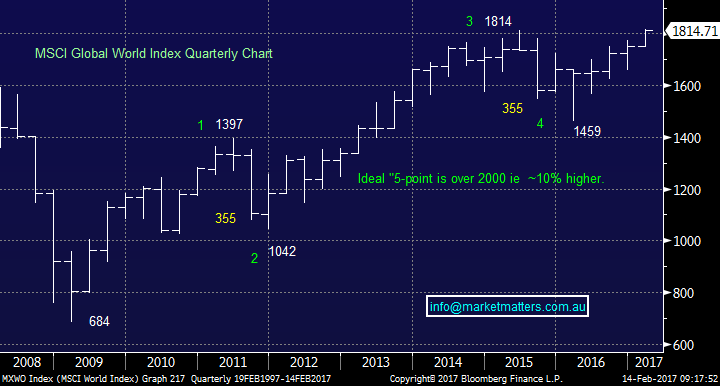
We only use technical analysis when the pattern is clear and ideally to support our view on a company / sector when investing in stocks. A great example that we are watching at present is the MSCI Global World Index which includes all the developed world's indices, three important points that we see from the following chart:
- The market has twice corrected exactly 355-points, at the time 25.4% and 19.6% respectively. This is a great example of why we often look for symmetry in retracements buy stocks, or increase exposure to indices overall i.e. technical analysis.
- The chart is following the classic "5 phase" bullish advance (similar to Elliott Wave to the technical traders) that we have often shown for the US S&P500, at this stage we are targeting ~2000 before a significant correction i.e. another+10% higher.
- US stocks have been charging to all-time highs, as they did again last night, but the global index has only just reached that milestone. This again coincides with our overall view that US stocks are now expensive compared to their counterparts and we will see some relative catch up during 2017.
MSCI World Index Chart
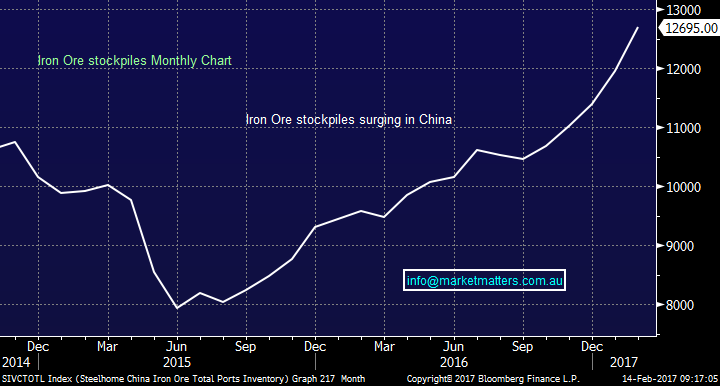
Lastly we saw iron ore surge another 6.5% last night as investors believe China is going to stimulate their economy yet again perhaps we will see a competition between Mr Trump and China around who can spend the most! The demand from China is clearly there and global economies are strong but we are seeing iron ore stockpiles in China surging to their highest levels since 2014. We feel this panic buying is going too fast too quickly leading to questionable euphoria in our resources sector.
Iron Ore Stockpiles Monthly Chart
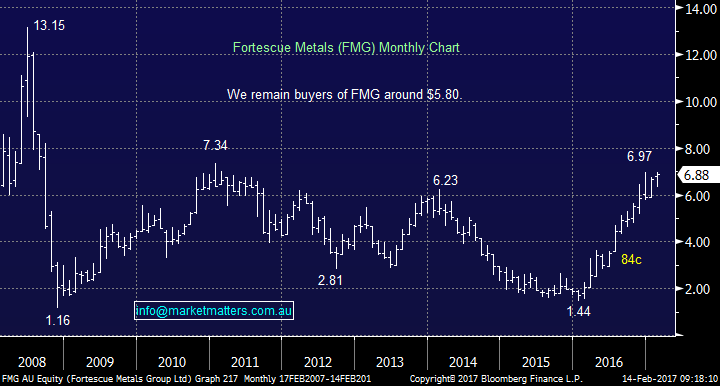
For the traders - We are sellers of FMG anywhere close to $7 targeting ~$6.
Fortescue Metals (FMG) Monthly Chart
Summary
- We remain short-term positive stocks but will look to sell into strength over 5800 in the ASX200.
- We are looking at a sell trade in FMG for a short term pullback.
Overnight Market Matters Wrap
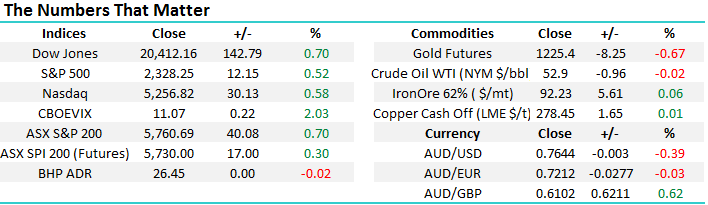
- A very strong night for equity markets across the board. Europe led the move early and the DOW has advanced by 0.7% to close at 20,412.
- Financials again the key mover, gaining over 1.1% and IT up by 0.7% also.
- Iron Ore and Copper continue to rally with Copper back to levels not seen since May 2015 and Iron Ore at 2 year highs after this 16% move in the last 5 trading sessions. BHP however is expected to have a breather with the stock ending its US session an equivalent of little change.
- UK and US CPI is out this week and Yellen has 2 days of testimony to Congress.
- The ASX 200 is expected to continue yesterday’s strength and rally ~24 points higher this morning, towards the 5,785 level as indicated by the March SPI Futures this morning.
Disclosure
Market Matters may hold stocks mentioned in this report. Subscribers can view a full list of holdings on the website by clicking here. Positions are updated each Friday.
Disclaimer
All figures contained from sources believed to be accurate. Market Matters does not make any representation of warranty as to the accuracy of the figures and disclaims any liability resulting from any inaccuracy. Prices as at 14/02/2017. 9.30AM.
Reports and other documents published on this website and email (‘Reports’) are authored by Market Matters and the reports represent the views of Market Matters. The MarketMatters Report is based on technical analysis of companies, commodities and the market in general. Technical analysis focuses on interpreting charts and other data to determine what the market sentiment about a particular financial product is, or will be. Unlike fundamental analysis, it does not involve a detailed review of the company’s financial position.
The Reports contain general, as opposed to personal, advice. That means they are prepared for multiple distributions without consideration of your investment objectives, financial situation and needs (‘Personal Circumstances’). Accordingly, any advice given is not a recommendation that a particular course of action is suitable for you and the advice is therefore not to be acted on as investment advice. You must assess whether or not any advice is appropriate for your Personal Circumstances before making any investment decisions. You can either make this assessment yourself, or if you require a personal recommendation, you can seek the assistance of a financial advisor. Market Matters or its author(s) accepts no responsibility for any losses or damages resulting from decisions made from or because of information within this publication. Investing and trading in financial products are always risky, so you should do your own research before buying or selling a financial product.
The Reports are published by Market Matters in good faith based on the facts known to it at the time of their preparation and do not purport to contain all relevant information with respect to the financial products to which they relate. Although the Reports are based on information obtained from sources believed to be reliable, Market Matters does not make any representation or warranty that they are accurate, complete or up to date and Market Matters accepts no obligation to correct or update the information or opinions in the Reports.
If you rely on a Report, you do so at your own risk. Any projections are estimates only and may not be realised in the future. Except to the extent that liability under any law cannot be excluded, Market Matters disclaims liability for all loss or damage arising as a result of any opinion, advice, recommendation, representation or information expressly or impliedly published in or in relation to this report notwithstanding any error or omission including negligence.
To unsubscribe. Click Here


