Weekly wrap & questions!
Following the "Market Matters 2017 Outlook piece" on Sunday this morning to keep subscribers fingers on the pulse we have updated how we see markets over coming weeks / months plus answered some very pertinent / tough questions we received from subscribers last week, as we always say, " keep the questions coming however hard!"
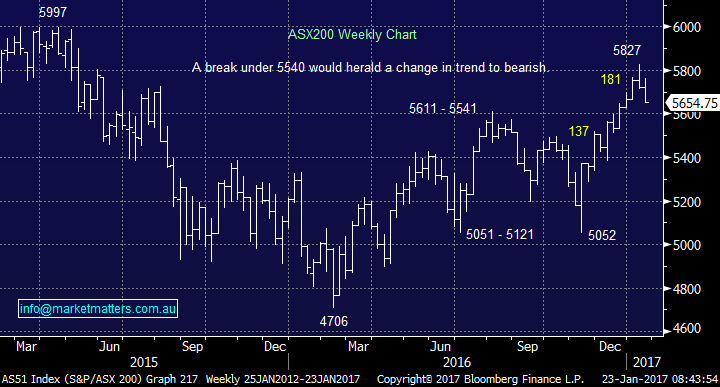
The local market has now corrected ~3% over the last 10 trading days and we continue to look to buy market weakness in the short term. We do not believe this recent weakness locally is the start of a major correction – yet. While the market is likely to open up around 20-points this morning our "Gut Feel" , especially when we consider global stocks, is the ASX200 will eventually test major support around 5600. With the MM portfolio sitting on ~40% cash we are looking to buy this weakness but will become very wary if the market fails and breaks under 5540.
ASX200 Weekly Chart
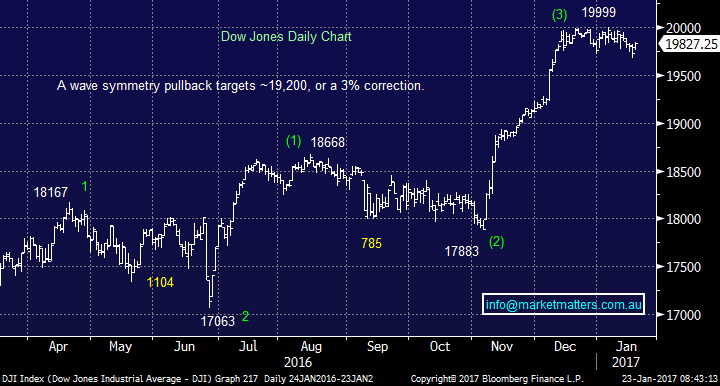
US stocks were incredibly quiet while Donald Trump became the 45th President of the USA but they traded in the same manner between August and October last year so it may continue a while yet. Our preferred scenario is an ongoing correction of ~3% but we will not become panic buyers if the US stocks squeeze to fresh al-time highs over coming weeks because we believe there is enough good news baked into current valuations that they will not follow through.
US Dow Jones Daily Chart
Importantly please be aware that for the rest of 2017 we will apply caveats on our market views outlining levels for the index that if hit, causes us to amend our view / positioning. This is simply because we are looking for a MAJOR top in 2017 and certainly do not want to be holding the can into that sort of price action.
When stocks corrected sharply around October 2014 (9.9%), August 2015 (12.5%) and January 2016 (14.5%) we were very confident to stand up in front of the "selling train" and go aggressively long, the next major correction we believe will be deeper and more painful for some - we are targeting a correction about twice as large. NB Percentages above are for the major US index the S&P500.
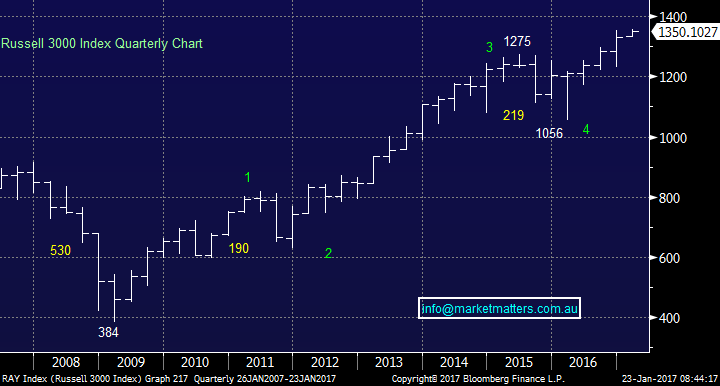
The US stock market has clearly broken above the highs of 2015 which we have been forecasting for the last year but how far it goes is a lot harder to predict. Importantly, we remain confident stocks will again test, and probably break, the lows of 2016 which already represents a 21.7% correction.
Russell 3000 Quarterly Chart
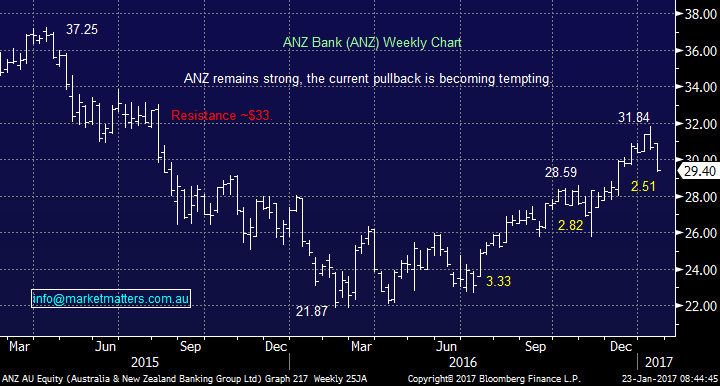
We are watching a number of stocks into this current weakness, especially within the financial sector which has fallen out of vogue in the last 2-weeks. We may average current holdings or add a new position depending on price action at the time of individual stocks e.g. ANZ which has already corrected 7.9% and would be ideal buying around $29.
ANZ Bank Ltd (ANZ) Weekly Chart
Summary
We remain buyers of stocks into weakness - for now! We currently like ANZ ~$29, RIO ~$59, SGR ~$4.60 and COH ~$120.
Some interesting questions this week!!
Question 1
"Hello There, you guy s put a buy order on HGG @ $3.85 this morning . By the time I received SMS , was 10 .21 am . The stock had moved 10 cent .How the are you supposed to buy on the weakness, when your S MS `s come too late. You have to get your information out earlier ,or put the buy signal out there the night before ,to your subscription holders." - cheers Paul
Hi Paul, we understand a frustrating situation but importantly, we’re working on a solution to improve the timing of our SMS alerts. Sometimes stocks move quickly and this was certainly the case with HGG on that day. It had low of $3.83 and a high of $3.98, but that range played out in the first 45mins of trade. That’s a 4% range in a very short amount of time which is not typical. Unfortunately, this will happen in the market at times and something out of our control. Rest assured we’re working hard to get alerts to subscribers as quickly as we possibly can.
Question 2 -Referencing our small profit on 50% of our CSL position:
"That was a horrible trade! We need a more long term set of holding stocks as well as the more short term trades you are recommending. Can you provide a core set of holding stocks and trade trading advise? Just a thought." - Regards, Ian
Hi Ian, one of our toughest jobs at MM is to keep all subscribers happy and we have recently started specifically identifying the anticipated timeframe behind the our investments.
A year, or two ago your request for a core portfolio would have been easy but we now strongly believe the bull market that stocks have enjoyed since the GFC is extremely mature and close to termination. Hence the market is likely to be more choppy and short-term orientated as we have been witnessing. Perhaps the best value we can add to investors like yourself is not just stock selection but also when we believe it's time to significantly increase cash holdings - avoiding a 25% correction will add great value to all investors and traders alike.
Question 3
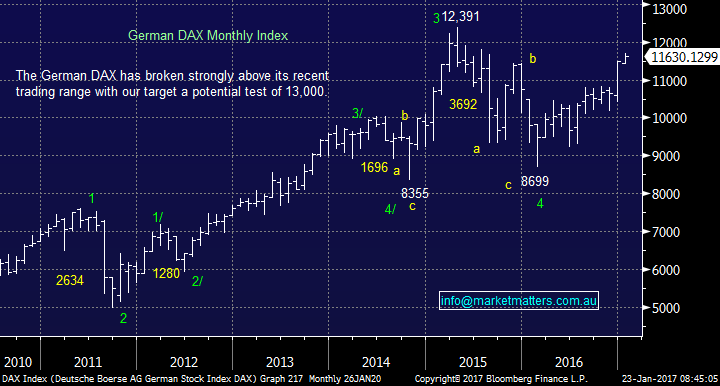
"Hi Folks, Welcome back and hope 2017 brings some handsome profits for all. My question relates to the potential trading opportunities listed in the last weekend report, specifically referring to a run in the German DAX and Japanese Nikkei. Appreciate if you could clarify how someone would go about trading a foreign index. Are there particular codes we can use on international markets, or is there an alternative way to trade domestically?" - Thanks Theo.
Good Morning Theo, there are a few different ways to trade these and similar views but the purest is via the futures market which is only recommended to sophisticated investors. In terms of ETFs specific to your question, the IJP is listed on the ASX and tracks the Japanese market, the IEU gives broad exposure to Europe, the IVV tracks the S&P 500, the WEMG tracks emerging markets and there are plenty more.
German DAX Monthly Chart
Question 4
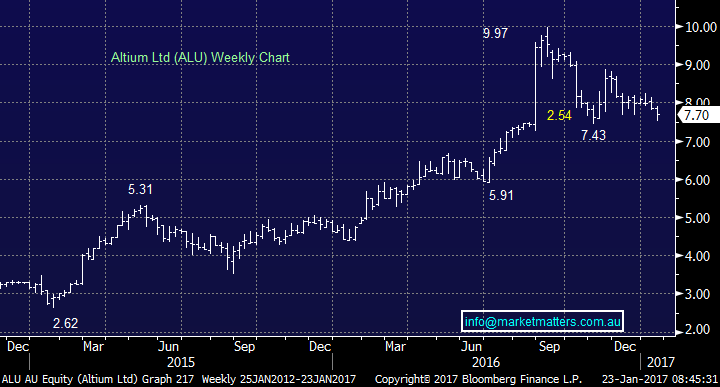
"Have you guys got a view on Altium? Seems to have been caught up in the high pe sell off. Stock down 25% on no news and 2 year cagr eps of circa 20%pa with a low 20 forecast pe." - Andrew.
Hi Andrew, your timing is exquisite, we were running the numbers over Altium (ALU) on Friday. The stock appears to have been caught up in the selling which has recently hit most high p/e stocks but as CSL showed us last week if the companies deliver the rebound can be huge. For those that don’t know, and in very simple terms, they are a printed circuit board software provider, or in other words, they provide the smarts for companies to design and make the circuit boards that are used in connected devices, and we all understand the growth in devices and their complexity over recent times.
Bloomberg has the stock on an estimated p/e of 25x for 2017 hence still not in the cheap basket – however this is a high growth business in a high growth area of the market. We like ALU very much and would be buyers after this current +20% correction around $7.70- our main reservation is the low volume which the stock trades on a day-day basis which makes quantifying the risk / reward a tough proposition.
Altium (ALU) Weekly Chart
Question 5
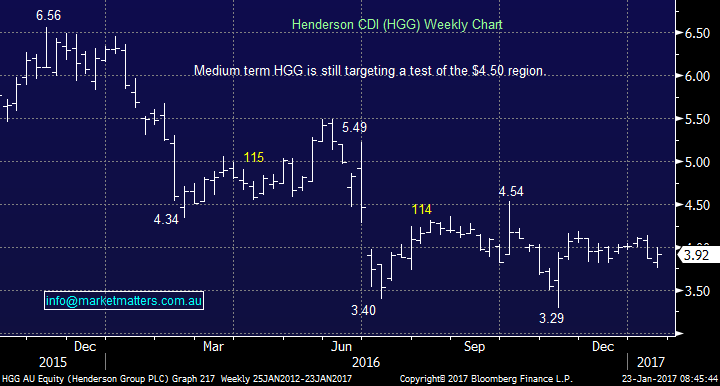
"Hi MM, at first glance of HGG chart is see a double top formation from a high in late Nov and early Jan. A neck line formation in Dec. The price looks to have traded below the neckline, thus almost confirming a break of the neckline. A close below the neckline for me would be confirmation of a dbl top, thus more down side. Just what I see from a technical side." -Thank You, Cam
Good morning Cam, a great question and the obvious answer is interpretation is what makes a market, our simple thoughts are below:
1. On a fundamental basis we like HGG which trades on a low valuation within its sector, likely due to its earnings exposure to the British Pound but we especially like its recent merger with Janus Capital.
2. We like the "Bull Pattern / pennant" that has formed since its panic $3.29 low, it has held the mid-point of $3.74 and rallied nicely in an "abc" manner back over $3.81.
3. We are at least targeting a weekly "abc" rally to test resistance ~$4.50.
Henderson Group (HGG) Weekly Chart
Overnight Market Matters Wrap
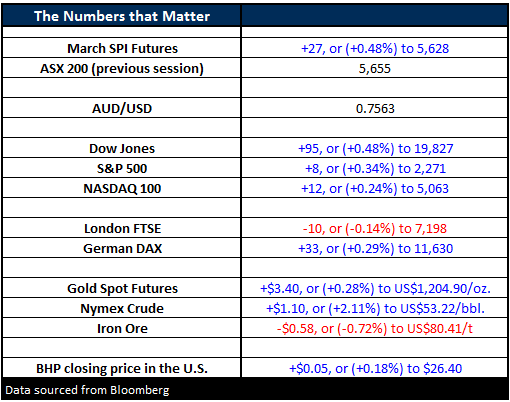
- The US share markets closed higher last Friday as US President, Donald Trump steps into office and renewed hopes of a fast-tracked growth in its economy.
- The Dow rallied 95 points (+0.48%) to 19,827, while the broader S&P 500 closed 8 points higher (+0.34%) at 2,271.
- Although Iron Ore was 0.72% lower last Friday to US$80.41/t., the materials sector in the US outperformed the broader market with BHP closing an equivalent of 0.18% higher to $26.40 from Australia’s previous close.
- The ASX 200 is expected to open 24 points higher, towards the 5680 area, as indicated by the March SPI Futures.
Disclosure
Market Matters may hold stocks mentioned in this report. Subscribers can view a full list of holdings on the website by clicking here. Positions are updated each Friday.
Disclaimer
All figures contained from sources believed to be accurate. Market Matters does not make any representation of warranty as to the accuracy of the figures and disclaims any liability resulting from any inaccuracy. Prices as at 23/01/2017. 9.30AM.
Reports and other documents published on this website and email (‘Reports’) are authored by Market Matters and the reports represent the views of Market Matters. The MarketMatters Report is based on technical analysis of companies, commodities and the market in general. Technical analysis focuses on interpreting charts and other data to determine what the market sentiment about a particular financial product is, or will be. Unlike fundamental analysis, it does not involve a detailed review of the company’s financial position.
The Reports contain general, as opposed to personal, advice. That means they are prepared for multiple distributions without consideration of your investment objectives, financial situation and needs (‘Personal Circumstances’). Accordingly, any advice given is not a recommendation that a particular course of action is suitable for you and the advice is therefore not to be acted on as investment advice. You must assess whether or not any advice is appropriate for your Personal Circumstances before making any investment decisions. You can either make this assessment yourself, or if you require a personal recommendation, you can seek the assistance of a financial advisor. Market Matters or its author(s) accepts no responsibility for any losses or damages resulting from decisions made from or because of information within this publication. Investing and trading in financial products are always risky, so you should do your own research before buying or selling a financial product.
The Reports are published by Market Matters in good faith based on the facts known to it at the time of their preparation and do not purport to contain all relevant information with respect to the financial products to which they relate. Although the Reports are based on information obtained from sources believed to be reliable, Market Matters does not make any representation or warranty that they are accurate, complete or up to date and Market Matters accepts no obligation to correct or update the information or opinions in the Reports.
If you rely on a Report, you do so at your own risk. Any projections are estimates only and may not be realised in the future. Except to the extent that liability under any law cannot be excluded, Market Matters disclaims liability for all loss or damage arising as a result of any opinion, advice, recommendation, representation or information expressly or impliedly published in or in relation to this report notwithstanding any error or omission including negligence.
To unsubscribe. Click Here


