Trump v Kim Jong-Un Equals Volatility?
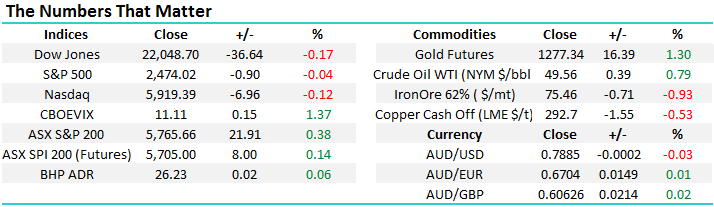
Yesterday the ASX200 confounded many traders as it rallied in the face of global uncertainty, ignoring falls across most Asian markets e.g. Japanese Nikkei -1.3% and Hong Kong’s Hang Seng -1.1%. CBA set the tone early rallying after a strong result but it actually ended the day the worst performer of the “big 4” banks only gaining 0.57%. The money managers also had a strong day following a great result from Janus Henderson which gained 5.6% coming on the coat tail of Tuesdays strong result and trading day by IOOF Holdings. These 2 strong sectors plus a solid “safety bid” in the healthcare and gold stocks managed to take the ASX200 0.4% higher when most market traders / watchers expected a sharp decline.
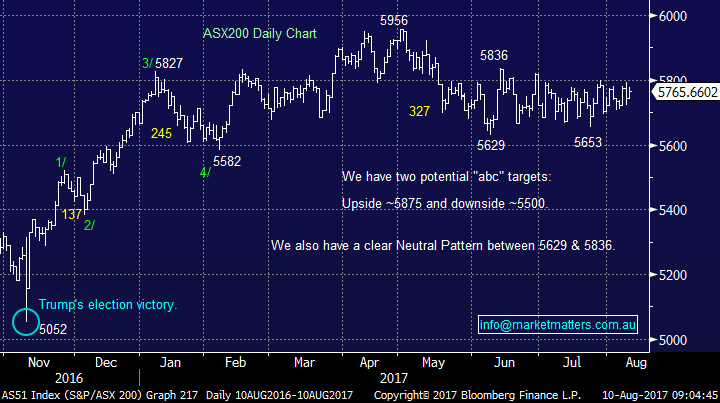
With North Korea and the US on the brink of war we now have a clear potential catalyst for the ASX200 to break out from its 12-week 5629-5836 range. If the situation unfortunately deteriorates we are likely to get a fall towards the 5500 area which we have targeted over recent weeks, alternatively a relatively quick and positive resolution now feels likely to send stocks higher.
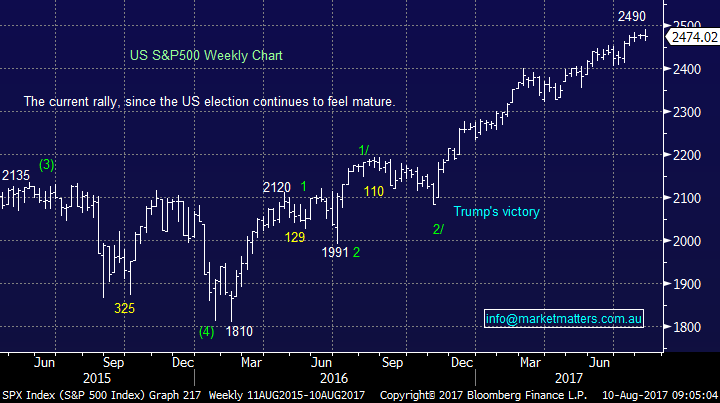
Our preference remains for a ~4.5% correction but we are far more confident with our short-term negative outlook for US stocks which have rallied 11.3% in 2017 compared to the ASX200 which has only just eked out a gain of 1.8% over the same period. Interestingly overnight the US bounced well in the last hour of trade to close basically unchanged, the local market predicted the move correctly.
ASX200 Daily Chart
US Stocks
US equities managed a good recovery in the last 1 ½ hours of trade last night and for now while they look “toppy and vulnerable” we must acknowledge their resilience in the face of bad news, usually a bullish sign! We remain bearish US stocks targeting a correction of ~5% but no sell signals have yet materialised.
US S&P500 Weekly Chart
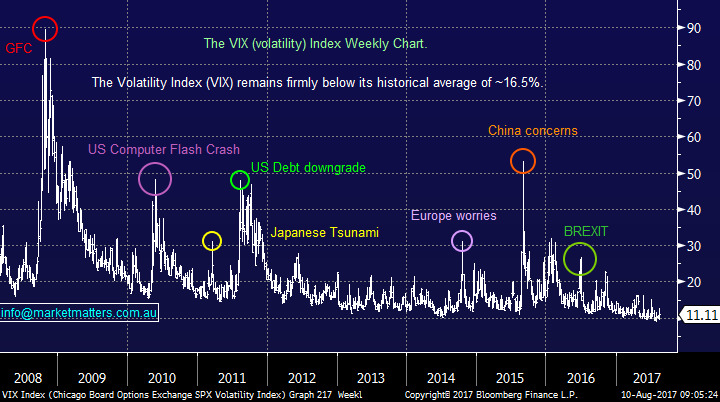
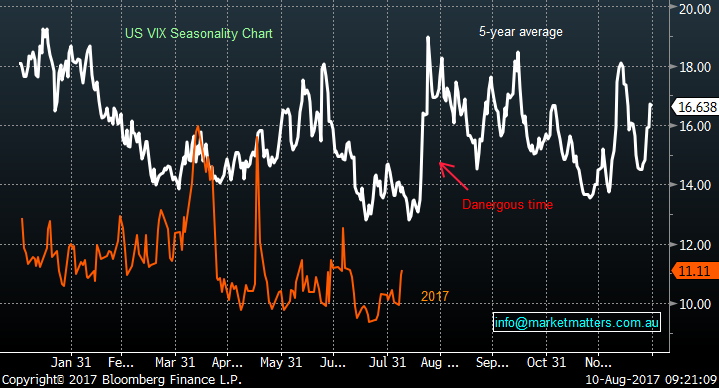
Not surprisingly the Fear Index (VIX) has rallied strongly over the last 48-hours as geo-political risks have increased dramatically. However, the index remains substantially below its historical 16.5% average which still feels complacent considering the respective world leaders involved i.e. we feel they definitely are more volatile than average!
US Fear Index (VIX) Weekly Chart
Also, on average, the VIX has a seasonal tendency to bottom out in July before rallying into a top in October. Considering the increasing geopolitical tensions between the US and North Korea, the possibility of seasonals being on the money in 2017 feels high.
US Fear Index (VIX) seasonality Chart
If we prove correct and August / September does become a tough period for equities then it’s the “crowded trades” where we see the most damage unfolding. Our favourite 3 candidates for a potentially sharp correction are:
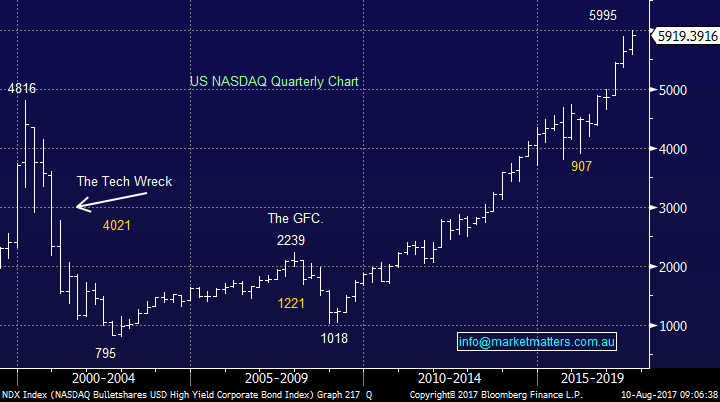
1 US NASDAQ Tech stocks
The NASDAQ Composite is trading on a valuation of 22.4x earnings, one standard deviation above the average of the last 15-years. The clear concern being the market is factoring in huge growth over the next few years leaving enormous room for disappointment i.e. they are priced for almost perfection! The NASDAQ is currently priced for earnings per share growth of 16.7% p.a. over the next 3-years BUT the historical reality is actually growth of just above 12% p.a. As you can see from the long-term NASDAQ chart tech analysts are serial optimists leading to the occasional very dramatic correction.
NASDAQ Quarterly Chart
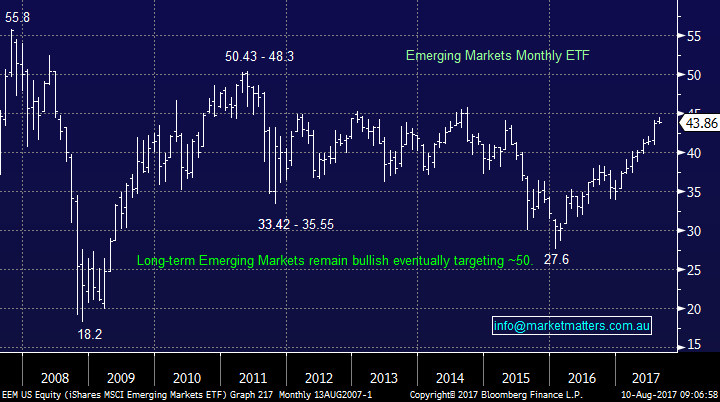
2 The Emerging Markets
The Emerging Markets have enjoyed an excellent rally in 2017 gaining over 27% as huge number of market analysts and commentators have turned bullish on the “cheap” sector. While we remain bullish the EM’s in the bigger picture a decent pullback of ~10%, similar to that in late 2016 would not surprise.
Emerging Markets (EEM) ETF Monthly Chart
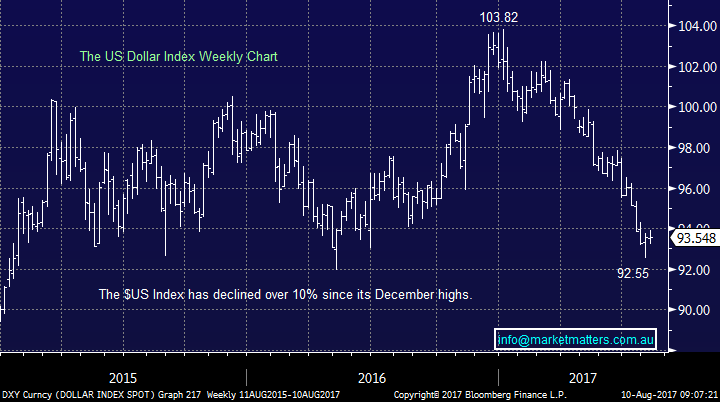
3 Short the $US
Analysts and economists alike commenced 2017 with their favourite trade “buy the $US” as they looked at rising interest rates and an improving economy. Here we are in August and the $US has tumbled ~10% and everyone’s now gone the other way! We believe the $US is perfectly positioned for a sharp countertrend rally, theoretically detrimental to commodities and gold.
$US Index Weekly Chart
Conclusion (s)
While holding over 20% of the MM Growth Portfolio in cash has felt frustrating on a number of occasions over the last few weeks we still feel it makes sense taking all the variables into account.
Overnight Market Matters Wrap
· The US markets closed with little change, but risk remains to the downside as investors close positions as geopolitical tensions rise yet again between North Korea and the US.
· This morning, the Reserve Bank of New Zealand kept its key interest rate unchanged at 1.75% as widely expected.
· Corporate earnings today are AGL, AMP, AVN, ORA and REA.
· The September SPI Futures is indicating the ASX 200 to follow the US and open with little change this morning from the previous settlement of 5765.
Disclosure
Market Matters may hold stocks mentioned in this report. Subscribers can view a full list of holdings on the website by clicking here. Positions are updated each Friday.
Disclaimer
All figures contained from sources believed to be accurate. Market Matters does not make any representation of warranty as to the accuracy of the figures and disclaims any liability resulting from any inaccuracy. Prices as at 10/08/2017. 8.00AM.
Reports and other documents published on this website and email (‘Reports’) are authored by Market Matters and the reports represent the views of Market Matters. The MarketMatters Report is based on technical analysis of companies, commodities and the market in general. Technical analysis focuses on interpreting charts and other data to determine what the market sentiment about a particular financial product is, or will be. Unlike fundamental analysis, it does not involve a detailed review of the company’s financial position.
The Reports contain general, as opposed to personal, advice. That means they are prepared for multiple distributions without consideration of your investment objectives, financial situation and needs (‘Personal Circumstances’). Accordingly, any advice given is not a recommendation that a particular course of action is suitable for you and the advice is therefore not to be acted on as investment advice. You must assess whether or not any advice is appropriate for your Personal Circumstances before making any investment decisions. You can either make this assessment yourself, or if you require a personal recommendation, you can seek the assistance of a financial advisor. Market Matters or its author(s) accepts no responsibility for any losses or damages resulting from decisions made from or because of information within this publication. Investing and trading in financial products are always risky, so you should do your own research before buying or selling a financial product.
The Reports are published by Market Matters in good faith based on the facts known to it at the time of their preparation and do not purport to contain all relevant information with respect to the financial products to which they relate. Although the Reports are based on information obtained from sources believed to be reliable, Market Matters does not make any representation or warranty that they are accurate, complete or up to date and Market Matters accepts no obligation to correct or update the information or opinions in the Reports.
If you rely on a Report, you do so at your own risk. Any projections are estimates only and may not be realised in the future. Except to the extent that liability under any law cannot be excluded, Market Matters disclaims liability for all loss or damage arising as a result of any opinion, advice, recommendation, representation or information expressly or impliedly published in or in relation to this report notwithstanding any error or omission including negligence.
To unsubscribe. Click Here


