Trump and the Kim Jong-un Smack Global Stocks
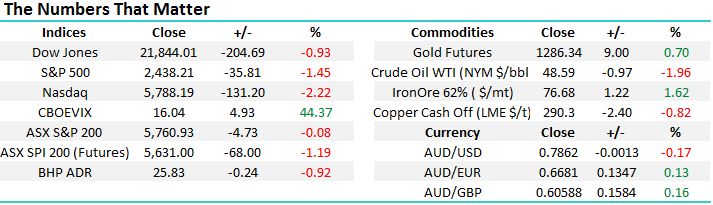
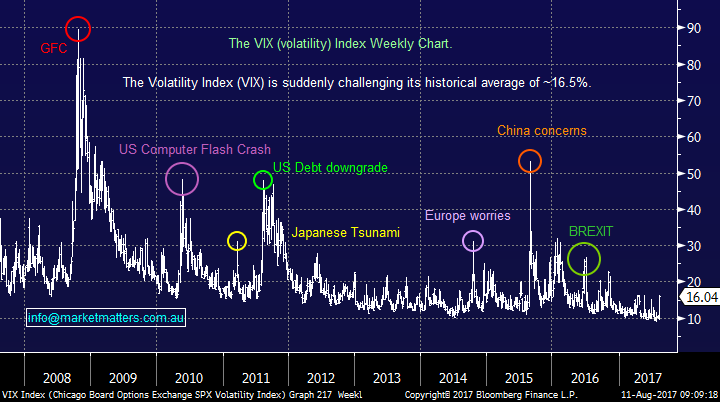
The ASX200 continues to confuse many seasoned traders, yesterday it closed marginally lower after being around 30-points higher at ~11.30am. For a change, we actually paid slight attention to global markets which turned lower through the day, especially the US futures who like local stocks turned down just before midday AEST. The North Korea situation clearly has markets rattled with local gold stocks in noticeable demand, led by heavyweight Newcrest Mining (NCM) which closed up almost 4% for the session. Yesterday’s moves all make sense, as global stocks have plunged the most since May, with the Dow falling ~1% and the NASDAQ well over 2%. The Fear Index (VIX) which we discussed in detail just yesterday soared 44% and is suddenly challenging its long-term average as North Korea fears rapidly escalate. Make no mistake on an economic level, Korea is very important e.g. South Korea is the largest producer of screens used in electronic devices, the second largest of semi-conductors plus one of the world’s largest car and ship builders.
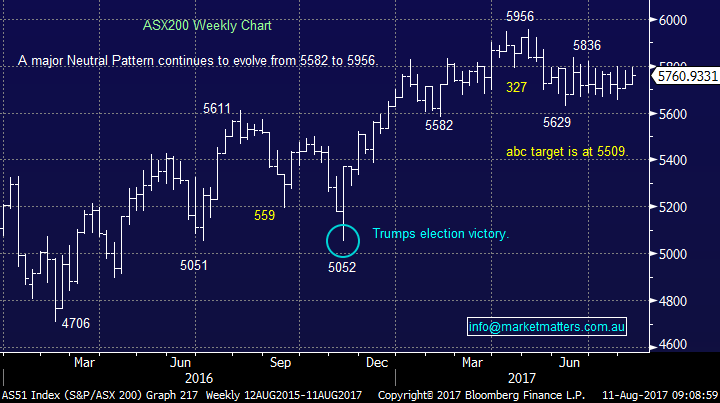
The ASX200 is poised to open ~70-points lower this morning, well under the psychological 5700 level and at new lows for the past fortnight, but will the sub-5700 buying which has been evident since early June return? Only time will tell obviously, but at MM we have our “buyer's hat” firmly in place looking for bargains!
No change to our view for local stocks over August / September, following the last 12-weeks of sideways action, a breakout is clearly overdue. Overall our preference remains a pullback towards the 5500 level, but the US indices do currently look weaker than our own.
ASX200 Weekly Chart
US “Fear Index” (VIX) Weekly Chart
US Stocks
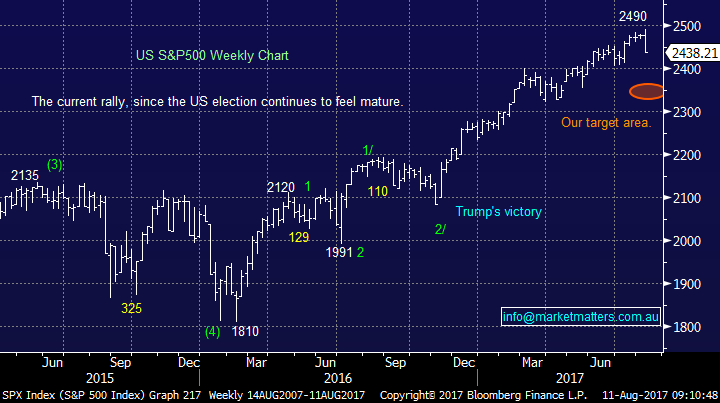
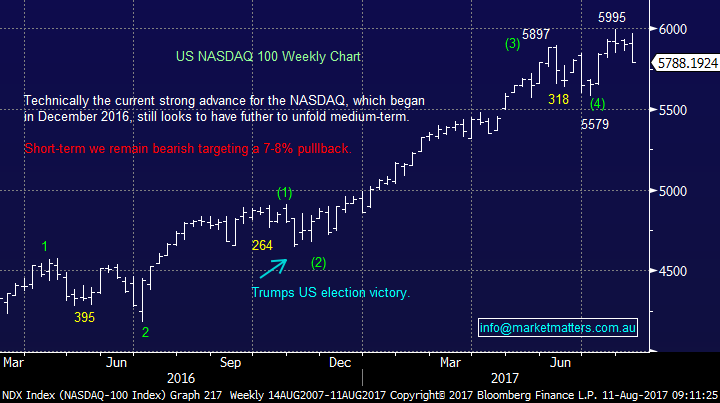
US equities were smacked last night with the broad S&P500 falling over 1.4% to make fresh 4-week lows. Our target area for US stocks is at least 4% lower i.e. in the 2350 region for the S&P500. The tech NASDAQ index has been our “go to” chart over recent months and it continues to follow our expected path – the NASDAQ has already corrected 3.5% from its July high with our target around 4% lower.
We remain bearish US stocks, targeting a correction of ~5% and sell signals are now firmly in place.
US S&P500 Weekly Chart
US NASDAQ Weekly Chart
Reporting season delivered a few surprises yesterday as would usually be expected, with disappointment coming from AMP, while Orora Ltd (ORA) kicked it out of the park rallying over 9% on the day. Today we will look at those 2 stocks, plus revisit another retail stock following Nick Scali’s (NCK) result which sent it down 8.4%, dragging other retailers along for the ride. The Australian economy is now worrying local retailers, not Amazon!
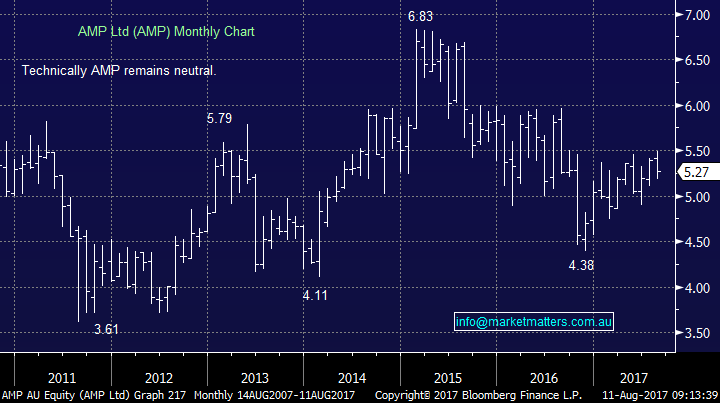
AMP Ltd (AMP) $5.27
AMP has been a serial disappointer for many years and yesterday proved no exception with the stock falling 2.6% following its result. The stock has been in a great sector from a performance perspective, but AMP has not participated i.e.Over the last year AMP is down -10% while Challenger (CGF) is up +45% and IOOF Holdings (IFL) up +28% respectively.
AMP’s results yesterday were broadly in line with market expectations, however the stock fell away after they announced plans to pause the buyback it announced in February to give flexibility and to reinvest for growth. We actually think that halting the buy-back is a good move in the medium term, even if the market dislikes it in the short term – investing for growth is what we want our corporates to do even if AMP is likely to take a long time to see the benefits. Unfortunately, it’s hard to get excited over this ‘old world’ stock for now but worth keeping an eye on.
We have no interest in AMP at current levels.
AMP Ltd (AMP) Monthly Chart
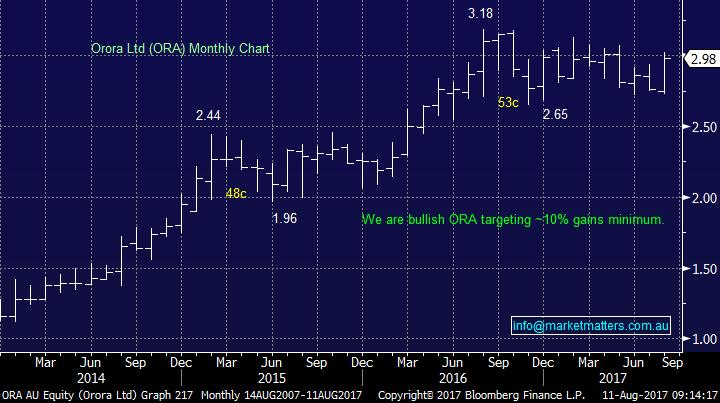
Orora Ltd (ORA) $2.98
ORA soared 9.2% following the release of the packaging company's full-year results. The gains were primarily due to an impressive performance from its North American business, ORA has now posted its third successive year of double-digit earnings growth.
We are bullish ORA targeting at least a further 10% upside.
Orora Ltd (ORA) Monthly Chart
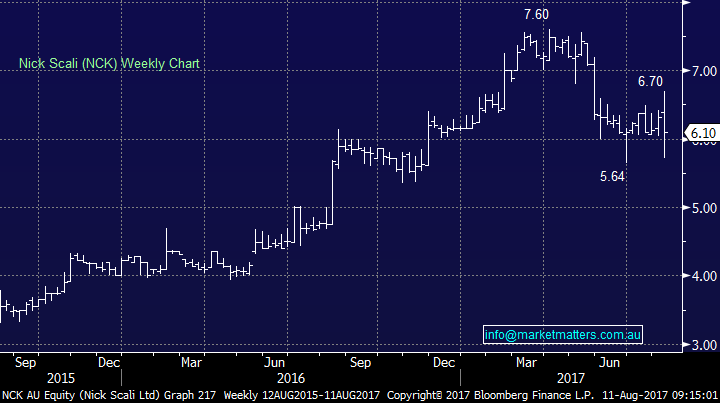
Nick Scali (NCK) $6.10
NCK had a good result yesterday, but was sold off aggressively as they expressed concern with the operating environment moving forward. However, NCK is doing everything right with a simple story to tell and on a FY18 valuation of ~15x, NCK is trading below the retailer sector average - and is cheap relative to the market. If we see renewed / continued panic style selling within the sector we will likely add to our existing position in the income portfolio around ~$5 or consider it for the growth portfolio.
Nick Scali (NCK) Weekly Chart
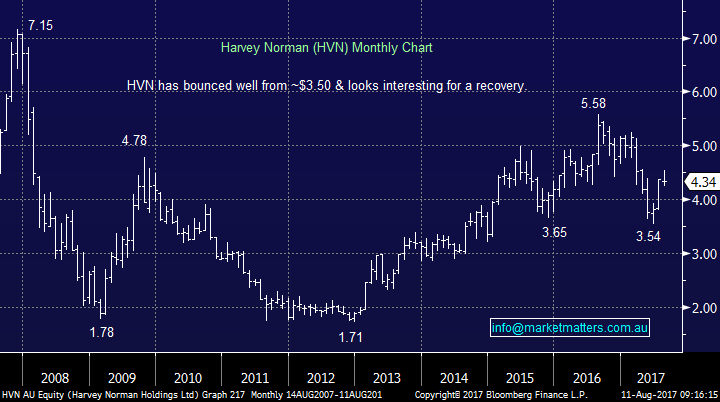
Harvey Norman (HVN) fell 2.7% yesterday, as investors focused on Nick Scali’s concerns for the trading environment moving forward. Despite the numerous negative headlines, HVN have actually been growing the top line consistently. The real threat as we see it from Amazon is more focussed on consumer electronics which are a part of HVN’s business, however the bulkier products like furniture and TVs, or higher value products like computers, or products that customers like to look and feel before purchasing are more in the defensive category, and HVN has significant exposure here.
Also, it’s worth noting that HVN is a property play, with around $2.30 per share underpinned by its property assets.Clearly, this is high risk buy in the current environment but the 7.14% fully franked dividend is also clearly attractive.
We may add to our existing position in the income portfolio around ~$4 or consider it for the growth portfolio.
Harvey Norman (HVN) Monthly Chart
Conclusion (s)
We remain buyers of any major market weakness and although our ideal target for the ASX200 is ~5500 we may slowly deploy some of our 23.5% cash holding in the Growth Portfolio before this area.
We like ORA under $3, NCK around $5 and HVN anywhere near $4.
Overnight Market Matters Wrap
· Global markets were in the red, with geopolitical tensions rising with the US and North Korea, sending the Volatility (VIX) index at its highest level since the US election.
· Investors continue to switch to ‘Safe haven’ assets with gold up 0.7% overnight.
· The September SPI Futures is indicating the ASX 200 to open 72 points lower, below the 5690 region this morning.
Disclosure
Market Matters may hold stocks mentioned in this report. Subscribers can view a full list of holdings on the website by clicking here. Positions are updated each Friday.
Disclaimer
All figures contained from sources believed to be accurate. Market Matters does not make any representation of warranty as to the accuracy of the figures and disclaims any liability resulting from any inaccuracy. Prices as at 11/08/2017. 8.00AM.
Reports and other documents published on this website and email (‘Reports’) are authored by Market Matters and the reports represent the views of Market Matters. The MarketMatters Report is based on technical analysis of companies, commodities and the market in general. Technical analysis focuses on interpreting charts and other data to determine what the market sentiment about a particular financial product is, or will be. Unlike fundamental analysis, it does not involve a detailed review of the company’s financial position.
The Reports contain general, as opposed to personal, advice. That means they are prepared for multiple distributions without consideration of your investment objectives, financial situation and needs (‘Personal Circumstances’). Accordingly, any advice given is not a recommendation that a particular course of action is suitable for you and the advice is therefore not to be acted on as investment advice. You must assess whether or not any advice is appropriate for your Personal Circumstances before making any investment decisions. You can either make this assessment yourself, or if you require a personal recommendation, you can seek the assistance of a financial advisor. Market Matters or its author(s) accepts no responsibility for any losses or damages resulting from decisions made from or because of information within this publication. Investing and trading in financial products are always risky, so you should do your own research before buying or selling a financial product.
The Reports are published by Market Matters in good faith based on the facts known to it at the time of their preparation and do not purport to contain all relevant information with respect to the financial products to which they relate. Although the Reports are based on information obtained from sources believed to be reliable, Market Matters does not make any representation or warranty that they are accurate, complete or up to date and Market Matters accepts no obligation to correct or update the information or opinions in the Reports.
If you rely on a Report, you do so at your own risk. Any projections are estimates only and may not be realised in the future. Except to the extent that liability under any law cannot be excluded, Market Matters disclaims liability for all loss or damage arising as a result of any opinion, advice, recommendation, representation or information expressly or impliedly published in or in relation to this report notwithstanding any error or omission including negligence.
To unsubscribe. Click Here


