To “Tech or not to Tech” that is the question (IPL, GNC, AAPL US, MSFT US, XRO, ALU, APX, TYR)
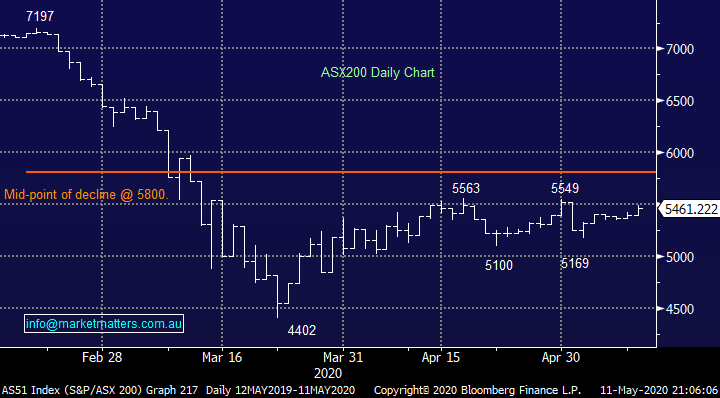
The ASX200 enjoyed another strong session to almost take May back to square, it actually feels like we’ve been stronger, but the damage inflicted by the 5% plunge on the 1st of the month is taking some repair work. When we consider the chart below of the local market its clearly been nothing more than sideways chop for over a month. The buying was again broad based yesterday as you would expect from a +70 point day, gains were enjoyed by over 75% of the market rally led by further migration up the “risk curve” as we touched on in yesterday’s afternoon note. Through the day Incitec Pivot (IPL) comfortably raised $600m as the liquidity rally continues, while Macquarie’s $400m hybrid opened and closed within the day.
While fund managers sit on cash its lucky for them that capital raisings are satisfying some of their current appetite for stocks otherwise they would be chasing stocks to levels which would afford little room for error as governments ease the COVID-19 lockdowns. Remember in mid-April the bank of America Fund Managers Survey showed extreme investor pessimism with cash levels the highest in over 9-years, with cash levels rising through February, March and April by definition the numbers of buyers into weakness increases making pullbacks shallower assuming the core market dynamics don’t change.
Last weekend I saw an example of things returning to “normal” when I filled up with fuel, an increase of almost 50% in a week = ouch! After NSW premier Gladys declared restaurants would open from Friday most are already booked out for the night, Sydney is clearly keen to get back out to socialise. Equities lead the economy on most occasions and they’re telling us things will be fine well before Christmas, although there is clear apprehension to undo much of the pandemics damage, makes sense to us hence our call for many weeks of sideways chop which remains on the money.
Investors are largely cashed up hence in our opinion any declines will fall short of many investors’ expectations.
While we remain bullish medium-term at MM the short-term picture is more uncertain as we all watch to see if the global return to work is successful without creating a second wave of coronavirus breakouts. Hence, we feel it’s prudent to maintain some cash on the sidelines in case we see another spike in concerns and market volatility.
MM remains bullish equities medium-term, hence we are in net “buy mode”.
ASX200 Index Chart
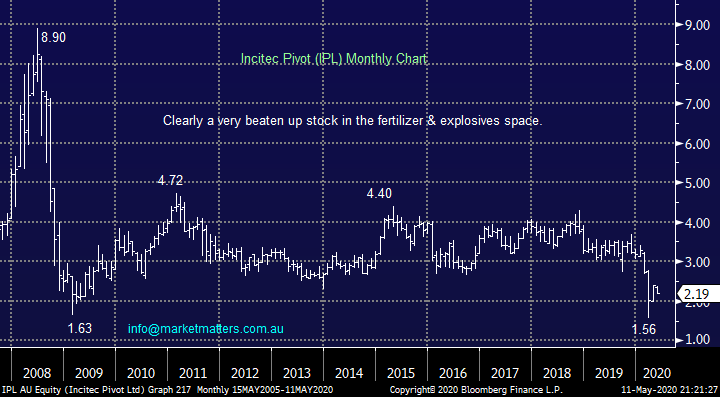
Another company tapped the market for cash on Monday, this time it was explosives and fertilizers business Incitec Pivot (IPL) who asked for $600m from institutions at $2, less than 9% below Fridays close - a substantial raise for a $3.5bn company. The book was well covered, and the company intends to use these funds to reduce debt after failing to sell its Australian fertilizers unit - also an additional SPP of $75m is underway.
The key takeout from this raise for us was the demonstration that fund managers remain cashed up and keen to put money to work.
MM is neutral IPL.
Incitec Pivot (IPL) Chart
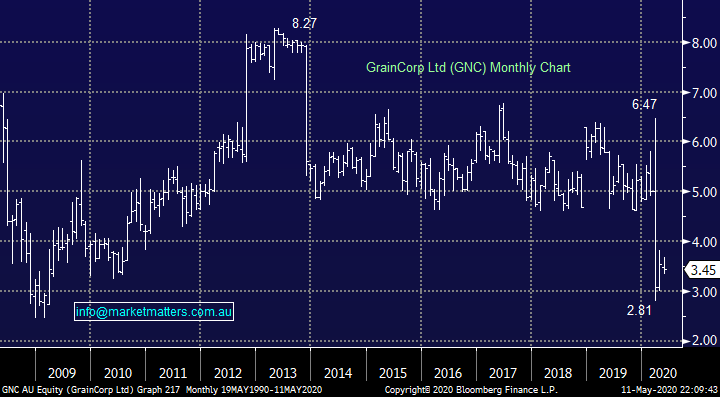
The worst performer on the local bourse yesterday was agribusiness GrainCorp (GNC) which fell over 4% around concerns that China will carry out its threat to impose an 80% tariff on imports from Australia – I question why are our politicians getting involved with rattling this dangerous cage as we battle the economic impact from COVID-19. While Barley exports to China have fallen by more than 50% over recent years it’s a precedent that we don’t need with the world’s second largest economy, imagine if its were to be iron ore next!
This morning I see the AFR talking China and steel in the same sentence & BHP was down 50c in the US.
Whether its comments about Wuhan or the treatment of Huawei this is not the time to pick a fight with our largest trading partner. Hopefully, this will all blow over but a 4% dip by GNC is not enough to catch our attention from a risk / reward perspective.
MM is neutral GNC.
GrainCorp Ltd (GNC) Chart
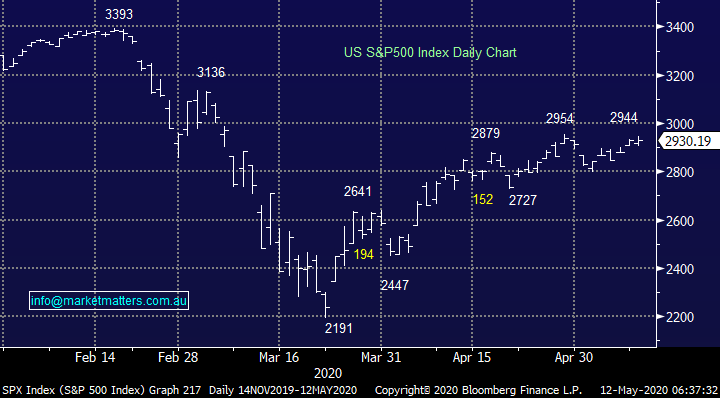
No major change with US stocks overnight as we again saw the tech-based NASDAQ make fresh post-March highs, while the Dow fell over 100-points – more on these relative moves later. In our humble opinion the trend that matters remains up but currently we are far keener on buying pullbacks as opposed to chasing strength as stocks continue to rally in a choppy manner – the US market has more of an upward bias than our own due to their heavyweight tech stocks.
MM remains bullish US stocks medium-term.
US S&P500 Index Chart
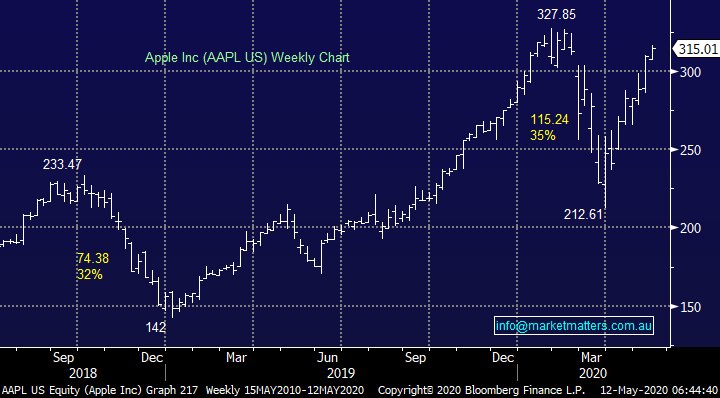
One of the best examples of current tech superiority is heavyweight Apple (AAPL US) which remains one of our favourite positions in the MM International Portfolio, it continues to rally strongly and is now less than 4% below its all-time high, a milestone we are confident will be surpassed in 2020 – just consider how far our heavyweight Banks & Resources are away from their respective all-time highs, miles is the unfortunate answer.
MM remains bullish Apple (AAPL US) initially targeting fresh all-time highs.
US Apple (AAPL US) Chart
To “Tech or not to tech” that is the question.
Please excuse my late night reminiscent of Shakespeare, it’s been a long time since I battled through one of his sonnets in the classroom wondering at the time what all the hoo-ha was about, I can just imagine the feedback today from our tech focused students. Tech is very much the topic I want to discuss again today as the NASDAQ’s rally continues unabated while many other sectors languish in its shadow. As we touched on above Apple (AAPL) is only 4% below its all-time high, while Microsoft looks set to breach its February top this week and Amazon (AMZN US) has already soared to new highs last month i.e. the FANGS are on fire!
Unfortunately, a factor which is a clear headwind for the ASX is the broad based market is actually struggling, especially on a relative level, consider the below 2 statistics:
1 – The “Big Five” of the FANG stocks, which now make up over 20% of the S&P500, are up more than 10% for the year.
2 – However, the remaining 495 stocks are down over 10% for the year.
Our point is two-fold, this is not a strong broad based “V-shaped” market recovery but one dominated by large tech, this throws up a couple of questions which I will attempt to cover today:
“Can the tech space continue its dramatic outperformance, if so what stocks should we jump on and at what price?” – at this stage our International Portfolio has a healthy mix of “Big Tech” but the Growth Portfolio only holds Xero (XRO), should we be shopping?
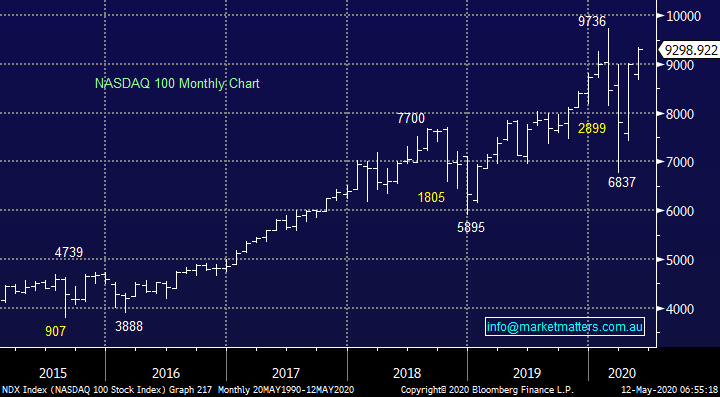
Our view is the NASDAQ will breach 10,000 in 2020/21, at least another 8% higher.
US NASDAQ Index Chart
I know at times I’m guilty of using lots of charts to make a point but a couple of relevant pearlers crossed my desk yesterday, they help illustrate exactly how the market has been evolving in 2020, both before and after the COVID-19 pandemic.
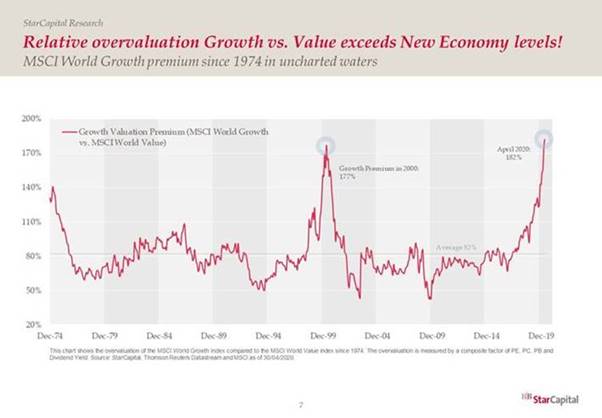
US Tech is becoming an ever-increasing portion of global share markets:
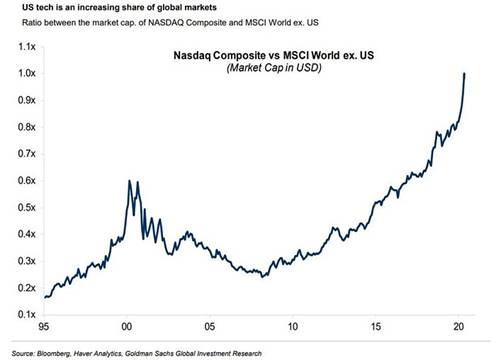
The relative valuation of Growth stocks is now above their dotcom peak as we see a company like Zoom enjoy revenue in excess of $US600m and a valuation of almost $US38b which would make it the 5th largest company on the ASX.
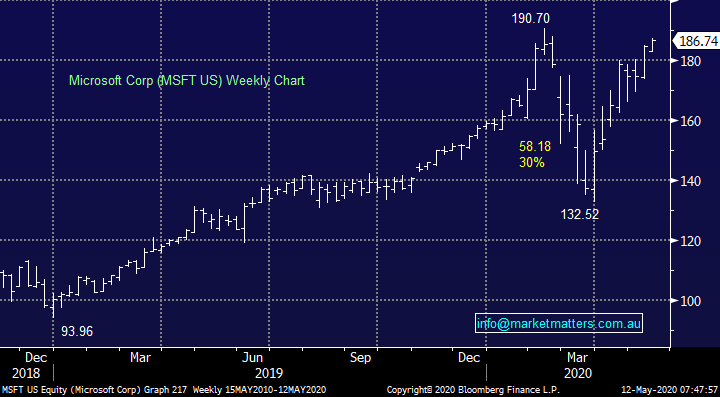
That’s enough, we’ve firmly established that techs are booming the question is has the train just left the station or is it time to be planning to disembark, especially as we do expect Value Stocks to come back into favour later in 2020. However, at this stage the significant drop-in interest rates and acceleration in the use of technology as the world increased its evolution has created the perfect backdrop for the likes of The Trade Desk (TTD US) and Amazon (AMZN US). Our answer is straightforward, following on from our view on the likes of Apple (AAPL US) and Microsoft (MSFT US) we are bullish US tech names although we do believe the time to increase weight to some Value names is approaching.
MM remains bullish US quality tech companies.
US Microsoft (US MSFT) Chart
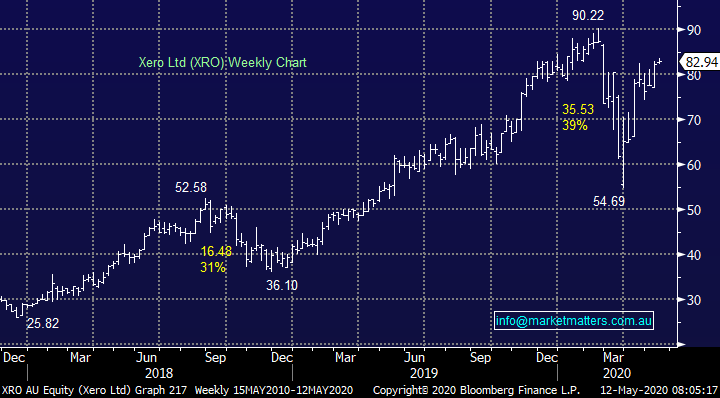
Hence if we like US tech how about Australian tech after their recent strong bounce i.e. should our purchase of Xero (XRO) be added to or is the risk / reward no longer exciting – I will look at some Asian names in tomorrow’s Overseas Report including Tencent which reports later today. We still like XRO which is no surprise as its up almost 25% in just over a month, nobody ever buys enough when stocks soar so aggressively! At current levels we aren’t excited about adding to our holding but back ~$75 would be a different sorry.
MM remains bullish and long XRO initially targeting ~15% further upside.
Today we have looked at our favourite 3 stocks in the sector after Xero (XRO), in hindsight we have been too pedantic with any buying but never say never! Investors, including ourselves, should always remember if you buy stocks making new highs with decent risk / reward you give yourself the best chances of gaining exposure to the huge market outperformers.
The likes of Technology One (TNE) which only has ~25% of its customer base exposed to COVID-19 was very close to being included in this morning’s list as businesses with perceived structural growth attract capital. Investors are buying these stocks looking many years out as opposed to the more common 6-12 months and until they disappoint the upside momentum feels entrenched. Basically investors are looking beyond COVID-19 for the sector and increased working from home (WFH) has only reaffirmed beliefs that we are evolving towards an ever increasing tech based world at an accelerated rate courtesy of the pandemic.
Xero (XRO) Chart
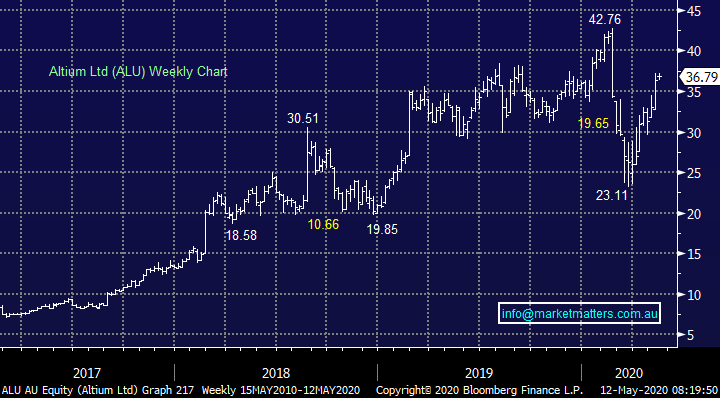
1 Altium (ALU) Ltd $36.79
We like this multinational software business, its debt free and actually had $US80m cash on hand at the end of 2019. This morning ALU has come out and stated they expect some headwinds due to COVID-19, that doesn’t put them on an island but may provide a good buying opportunity as valuation is the main concern with ALU close to $37.
MM is bullish ALU and a keen buyer of any weakness.
Altium (ALU) Chart
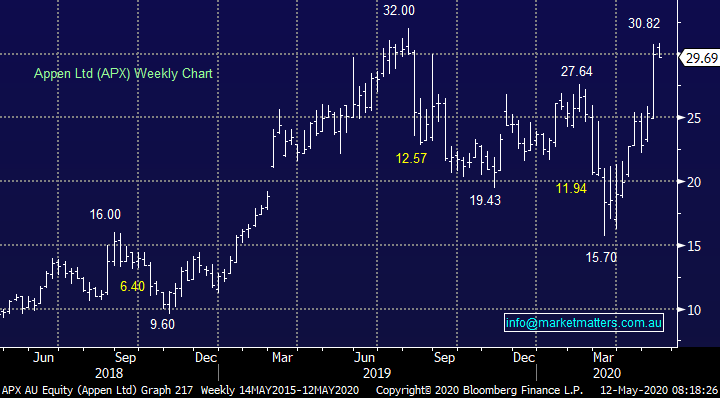
2 Appen Ltd (APX) $29.69
Artificial Intelligence (AI) business APX actually drifted yesterday in a strong market, perhaps it’s time for a rest. This is a stock we would like to own and while we aren’t keen to chase above $30 as we expect a little short-term market weakness, it’s more of a question of where not if to buy.
MM likes APX now ideally below $28.
Appen Ltd (APX) Chart
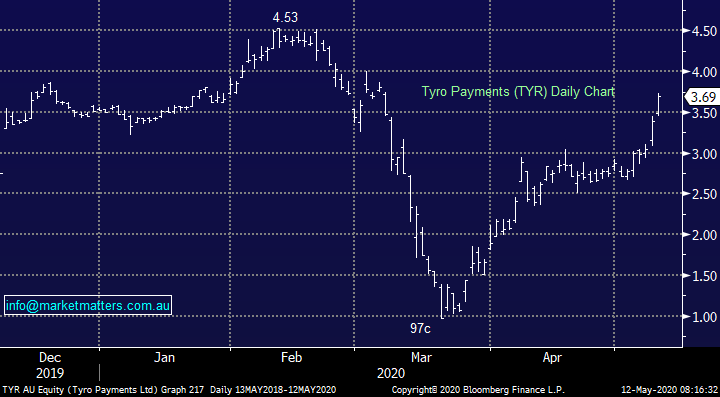
3 Tyro Payments (TYR) $3.69
As a reminder, Tyro is one of the fastest growing payment terminal providers in Australia and they’ve been very helpful throughout the pandemic with increased disclosure around transaction volumes which provides insight into broader spending patterns. As we mentioned yesterday afternoon, the turning point in terms of daily payments through their machines looks to have passed with transactions now on the up = bullish indicator – see bar chart below. We’ve seen Afterepay (APT) fly this month since its tie up with Tencent, TYR looks to be enjoying some sector buying and we still see at least another 30% upside making this an attractive play in our opinion.
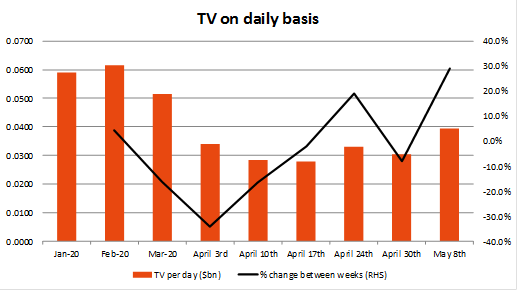
Source: Shaw and Partners
MM likes the risk / reward on TYR with stops below $3.
Tyro Payments (TYR) Chart
Conclusion
MM likes all 3 stocks considered today.
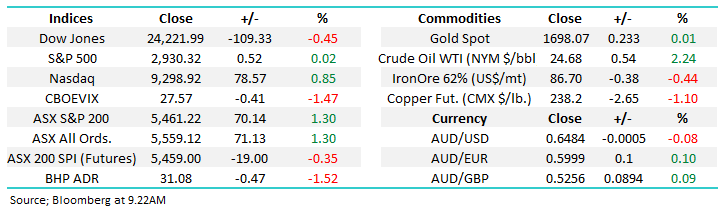
Overnight Market Matters Wrap
· The SPI is down 19 points after a mixed night in US equities. The Dow fell 0.4%, the S&P 500 was flat while the NASDAQ rallied 0.8%.
· The NASDAQ was helped by strong performances from FAANG and other tech related stocks, in particular Microsoft and Apple. The index sits just 7% below its all-time high in February.
· There is concern that new coronavirus infections are rising in some countries that have started to relax lockdown rules such as in South Korea and China.
· Most metals on the LME were better, while iron ore was flat. Gold is trading at $US1698/oz and oil fell 2.5% despite the Saudis saying they will cut production to the lowest levels in 18 years
Have a great day
James & the Market Matters Team
Disclosure
Market Matters may hold stocks mentioned in this report. Subscribers can view a full list of holdings on the website by clicking here. Positions are updated each Friday, or after the session when positions are traded.
Disclaimer
All figures contained from sources believed to be accurate. All prices stated are based on the last close price at the time of writing unless otherwise noted. Market Matters does not make any representation of warranty as to the accuracy of the figures or prices and disclaims any liability resulting from any inaccuracy.
Reports and other documents published on this website and email (‘Reports’) are authored by Market Matters and the reports represent the views of Market Matters. The Market Matters Report is based on technical analysis of companies, commodities and the market in general. Technical analysis focuses on interpreting charts and other data to determine what the market sentiment about a particular financial product is, or will be. Unlike fundamental analysis, it does not involve a detailed review of the company’s financial position.
The Reports contain general, as opposed to personal, advice. That means they are prepared for multiple distributions without consideration of your investment objectives, financial situation and needs (‘Personal Circumstances’). Accordingly, any advice given is not a recommendation that a particular course of action is suitable for you and the advice is therefore not to be acted on as investment advice. You must assess whether or not any advice is appropriate for your Personal Circumstances before making any investment decisions. You can either make this assessment yourself, or if you require a personal recommendation, you can seek the assistance of a financial advisor. Market Matters or its author(s) accepts no responsibility for any losses or damages resulting from decisions made from or because of information within this publication. Investing and trading in financial products are always risky, so you should do your own research before buying or selling a financial product.
The Reports are published by Market Matters in good faith based on the facts known to it at the time of their preparation and do not purport to contain all relevant information with respect to the financial products to which they relate. Although the Reports are based on information obtained from sources believed to be reliable, Market Matters does not make any representation or warranty that they are accurate, complete or up to date and Market Matters accepts no obligation to correct or update the information or opinions in the Reports. Market Matters may publish content sourced from external content providers.
If you rely on a Report, you do so at your own risk. Past performance is not an indication of future performance. Any projections are estimates only and may not be realised in the future. Except to the extent that liability under any law cannot be excluded, Market Matters disclaims liability for all loss or damage arising as a result of any opinion, advice, recommendation, representation or information expressly or impliedly published in or in relation to this report notwithstanding any error or omission including negligence.


