The $US is playing the tune for many stocks

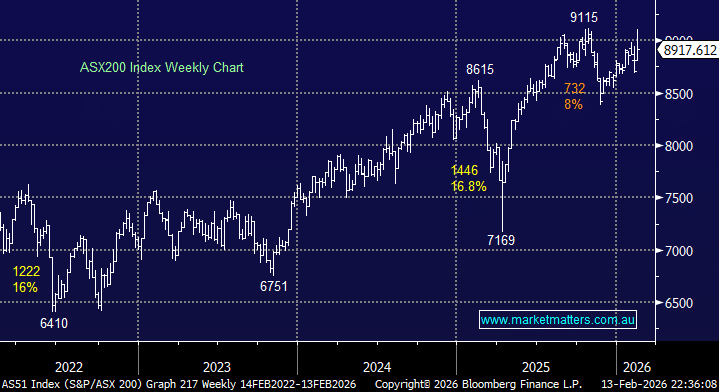
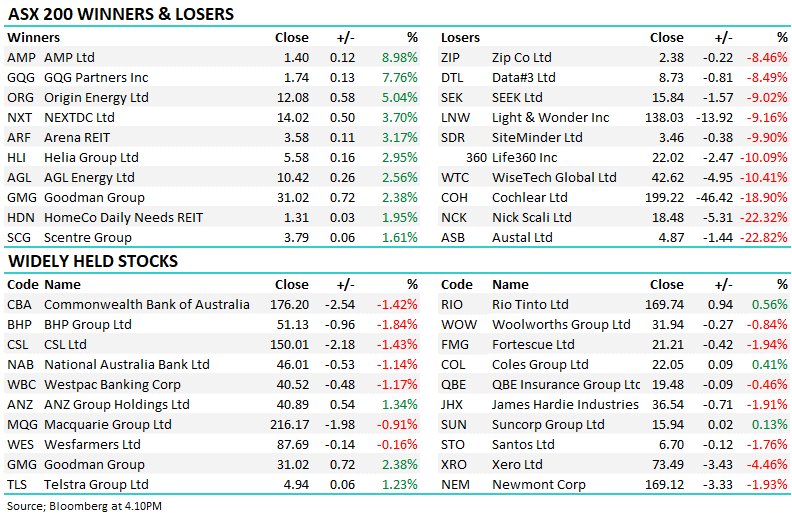
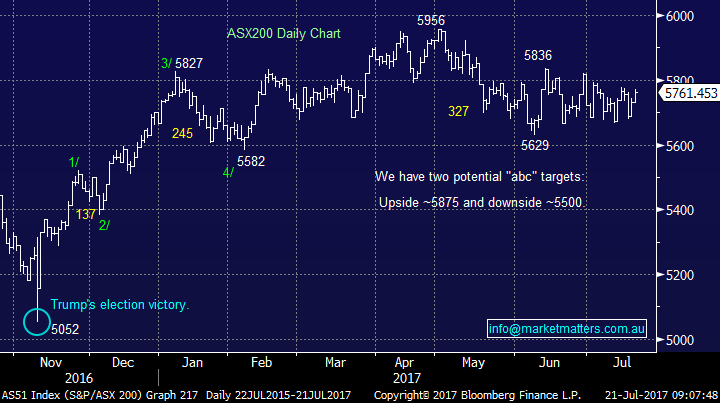
The ASX200 finally managed to string together 2 strong days in a row, primarily courtesy of the big 4 banks i.e. over the last 2-days the market has rallied 1.3% while CBA has outpaced it 3-fold soaring 3.9%. There still appears to be a distinct lack of money flowing in or out of the market, the game has now remained sector rotation for almost 10-weeks - caution is warranted for the traders out there as an index breakout feels close at hand.
We are watching two distinct “Neutral Patterns” for clues to the next 4-5% market swing as we search for optimum entry / exit levels for the MM portfolio. These patterns are hopefully clear on the daily chart, but if you have any queries, please do not hesitate to ask and we will cover them in more detail during Monday’s morning report.
1. Since the 20th of December the ASX200 has traded in a 374-point range between 5582 and 5956, with most of the time spent around the 5770 mid-point area. A false break under 5582 would generate an excellent risk / reward buying opportunity.
2. Since the 18th of May, the ASX200 has traded in a 207-point range between 5629 and 5836, with most of the time being spent around the 5730 mid-point area. Similarly, a false break under 5629 would generate an excellent buying opportunity but a false spike over 5836 would be the reverse and put us in strong sell mode.
Taking into account that seasonally the ASX200 usually rallies into the end of July, before struggling for the next 2-months, the ideal scenario for us is a short-term rally for the market over 5850 enabling us to significantly reduce our market exposure. Also remember that since the GFC July has seen the ASX200 gain an average of 4.04% but so far, this month we are only up 0.7%.
Hence, we remain mildly bullish short-term, but are looking to increase our cash position in coming weeks. However, the day to day internals do feel average when we consider that our market is essentially unchanged over the last 10 weeks while the Dow is up ~4%.
ASX200 Daily Chart
US Stocks
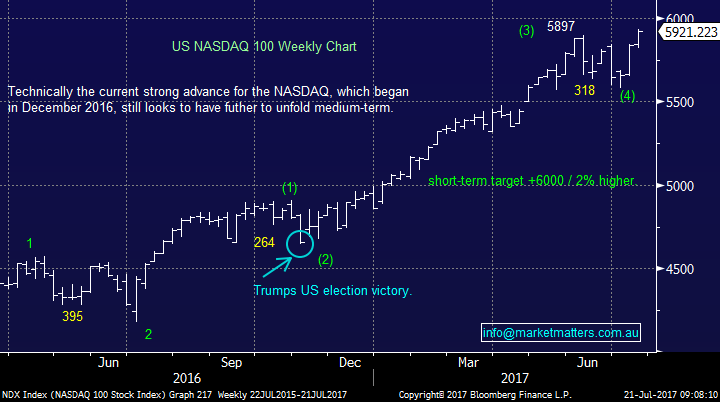
Last night, US equities were very quiet while holding around all-time highs. There remains no change to our current view, we are targeting ongoing gains for the NASDAQ probably over 6000, now only ~ 2% higher, before a decent correction to test the early July lows.
Hence our view on the risk / reward is not compelling for buyers i.e. 2% upside v 7% downside.
US NASDAQ Weekly Chart
European Stocks
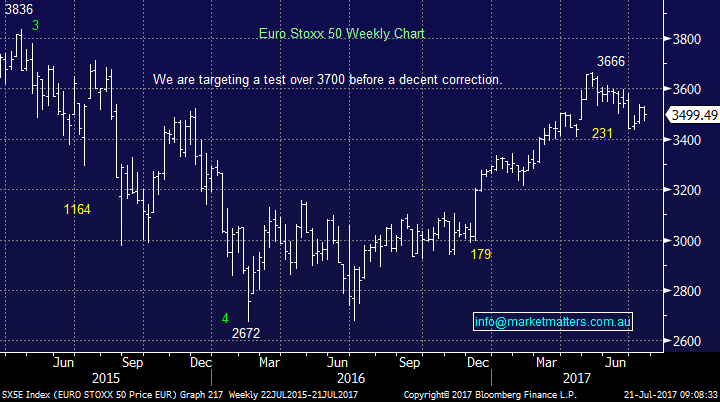
No change, the Euro Stoxx 50 looks aligned with the NASDAQ, ideally targeting a break over 3700 prior to a decent correction, but conversely the German DAX is targeting further weakness before it hits our target pullback area. The key question is “if” the US and European stocks can make these anticipated fresh 2017 highs will the local ASX200 finally manage to eke out some gains.
Euro Stoxx 50 Weekly Chart
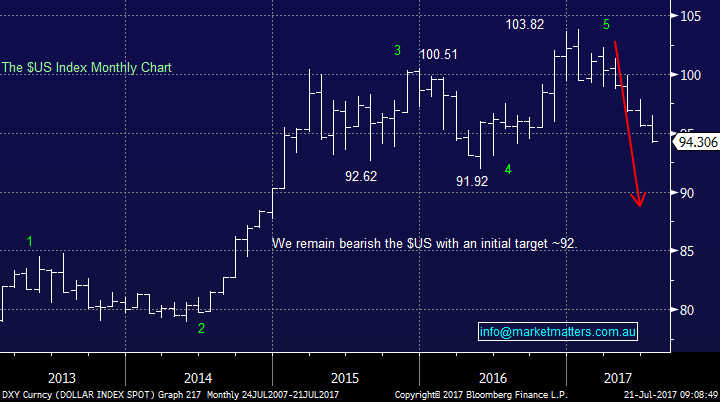
The $US has not enjoyed 2017 to-date falling almost 8% after starting the year as one the most popular bullish picks by global investment managers. Our view for the $US has not waivered, but is having a huge impact on the relative performance of a number of local stocks who have significant $US earnings.
1. We remain bearish the $US through 2017 and 2018.
2. After a poor 7-months a 4-6-week bounce feels a strong possibility.
If we are correct, the $A should be trading over 80c later in the year, interestingly making it harder for the RBA to lift interest rates.
A bounce in the $US should lead to a short-term pullback in resources and a recovery in $US exposed stocks, but we believe the trends of recent times are likely to recommence in Q4 of 2017. Today we have looked at 4 stocks / sectors that illustrate what we are discussing and the subsequent implications for investing around the $US in 2017.
The big issue here is being long $US earners has been a big theme for a number of years and it’s going to take fund managers many months to get off this crowded train.
$US Monthly Chart
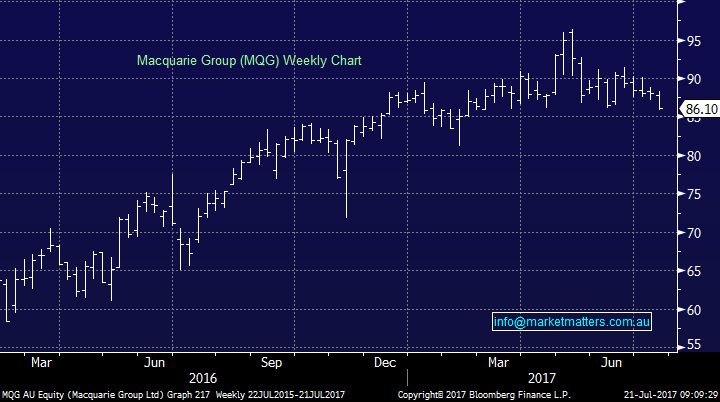
1 Macquarie Bank (MQG) $86.10
MQG now has a significant portion of its earnings in $US and we believe it’s starting to pay the price. We are now bearish MQG initially targeting ~$81.
Macquarie Bank (MQG) Weekly Chart
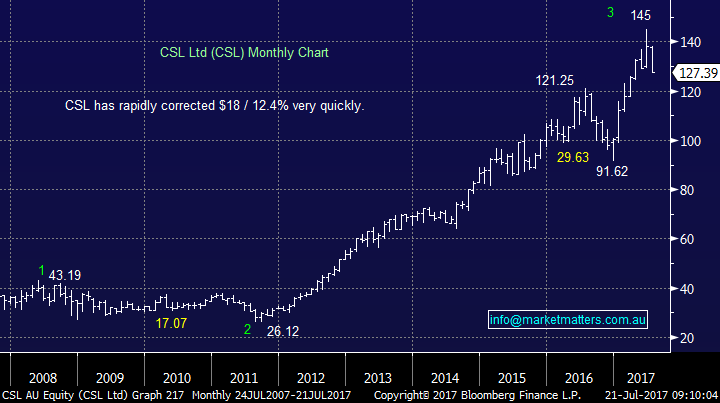
2 CSL Ltd (CSL) $127.39
We have mentioned CSL a number of times over recent weeks, but it’s also a large $US earner which compounds our negative view for 2017/8. We still believe that MM will be able to buy CSL well under $100 moving forward, but a short-term bounce would not surprise after the recent $18 fall.
CSL Ltd Monthly Chart
3 The resources sector
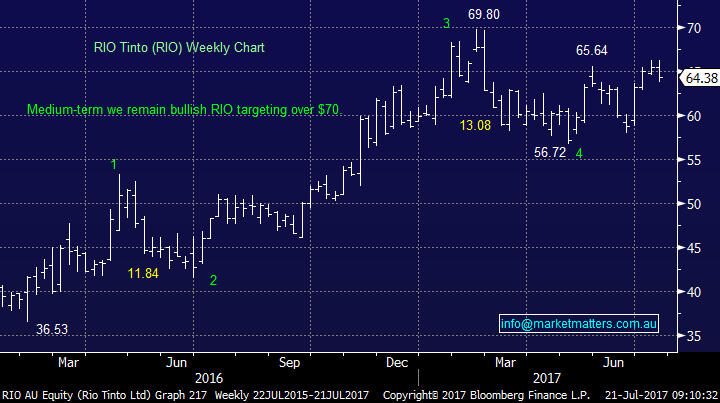
If we are correct and the $US is poised for a 4-6 week bounce, the likelihood is commodities will pullback and resource stocks are likely to tread water, or pullback. We have definitely seen evidence of this over the last week with plenty of reasons for local resource stocks to rally, but they’ve stalled as any major buying has been bank focused.
From a medium-term investment perspective, we are buyers of weakness in resources, not sellers however we are open to reducing our exposure in the short term.
RIO Tinto (RIO) Weekly Chart
4 The Gold sector
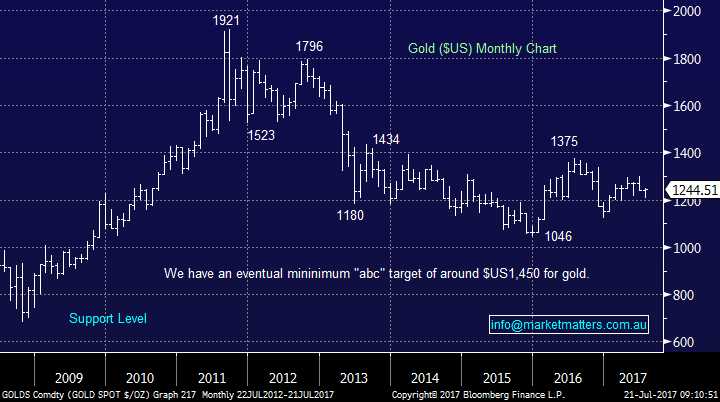
Gold has had an ok year so far as would be expected with an 8% decline in the $US although gains have been far from spectacular. We continue to look for optimum levels to increase our gold exposure, currently on the radar:
- NCM under $19, RRL under $3.20 and EVN under $2.
Taking into account we are expecting a bounce in the $US, we are in no hurry as recent weakness within the gold sector is likely to have a few more weeks to play out.
Gold Monthly Chart
Conclusion (s)
We remain bearish the $US, but anticipate a bounce in the coming 4-6 weeks.
1. We are not buyers of $US earners until they have a washout in coming months / years.
2. We are still looking to buy the gold sector into weakness.
Overnight Market Matters Wrap
· The US closed with little change again overnight, with defensive names outperforming against the commodities names.
· As mentioned, most key commodities retreated, with iron ore down 3.12% at US$68.05/t, following its recent strong rebound, while crude oil dropped back to US$46.92/bbl.
· The June SPI Futures is indicating a soft open in the ASX 200 this morning, towards the 5,745 area.
Disclosure
Market Matters may hold stocks mentioned in this report. Subscribers can view a full list of holdings on the website by clicking here. Positions are updated each Friday.
Disclaimer
All figures contained from sources believed to be accurate. Market Matters does not make any representation of warranty as to the accuracy of the figures and disclaims any liability resulting from any inaccuracy. Prices as at 21/07/2017. 8.00AM.
Reports and other documents published on this website and email (‘Reports’) are authored by Market Matters and the reports represent the views of Market Matters. The MarketMatters Report is based on technical analysis of companies, commodities and the market in general. Technical analysis focuses on interpreting charts and other data to determine what the market sentiment about a particular financial product is, or will be. Unlike fundamental analysis, it does not involve a detailed review of the company’s financial position.
The Reports contain general, as opposed to personal, advice. That means they are prepared for multiple distributions without consideration of your investment objectives, financial situation and needs (‘Personal Circumstances’). Accordingly, any advice given is not a recommendation that a particular course of action is suitable for you and the advice is therefore not to be acted on as investment advice. You must assess whether or not any advice is appropriate for your Personal Circumstances before making any investment decisions. You can either make this assessment yourself, or if you require a personal recommendation, you can seek the assistance of a financial advisor. Market Matters or its author(s) accepts no responsibility for any losses or damages resulting from decisions made from or because of information within this publication. Investing and trading in financial products are always risky, so you should do your own research before buying or selling a financial product.
The Reports are published by Market Matters in good faith based on the facts known to it at the time of their preparation and do not purport to contain all relevant information with respect to the financial products to which they relate. Although the Reports are based on information obtained from sources believed to be reliable, Market Matters does not make any representation or warranty that they are accurate, complete or up to date and Market Matters accepts no obligation to correct or update the information or opinions in the Reports.
If you rely on a Report, you do so at your own risk. Any projections are estimates only and may not be realised in the future. Except to the extent that liability under any law cannot be excluded, Market Matters disclaims liability for all loss or damage arising as a result of any opinion, advice, recommendation, representation or information expressly or impliedly published in or in relation to this report notwithstanding any error or omission including negligence.
To unsubscribe. Click Here


