The $US fall is dominating markets, but what now? (OZL, BHP, NCM)
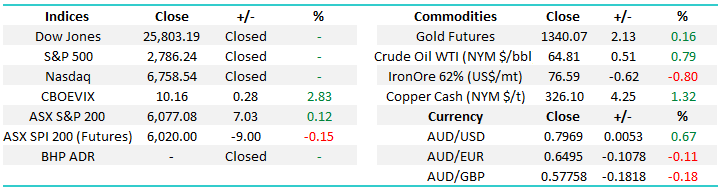
Yesterday gave us another strong opening by Australian stocks, courtesy of the Dow, followed by a ~50-point drift lower, a story that unfortunately sounds all too familiar for Australian investors over recent times. The big miners again managed to keep us in the black but even they slipped intra-day as iron ore prices retreated during Asian trade.
Local and global market activity has been focused on interest rates and the $US over recent times leading to logical declines of -6% by our real estate sector and -5.5% in the Utilities over the last 3-months. Over the same period our ASX200 has rallied +3.9%, primarily helped by the large cap miners. Fund managers are clearly realigning their portfolios for anticipated rate hikes in 2018/9.
Interestingly the $US is weakening as fund managers see more scope for higher rates in Europe moving forward than the US but this is a potentially dangerous view to follow. In our view, the yanks are likely to raise rates more aggressively than the Europeans given the relative strength of the US economy and supportive / stimulatory Trump led Govt policies which should help to feed inflation – the Oil price and eventual wage growth are also important factors here. As a side note European stocks are struggling a bit under the competitive weight of a stronger currency, something that’s probably also hindering the ASX200.
UK housing prices have just hit a 2 ½ year low and it feels like global investors / speculators are finally moving from property to equities and of course Bitcoin for the adrenalin junkies! This also makes sense as equities in general, and especially the cyclical stocks, usually outperform property when interest rates increase. Examples of cyclical stocks are energy, resources, financials, industrials and IT.
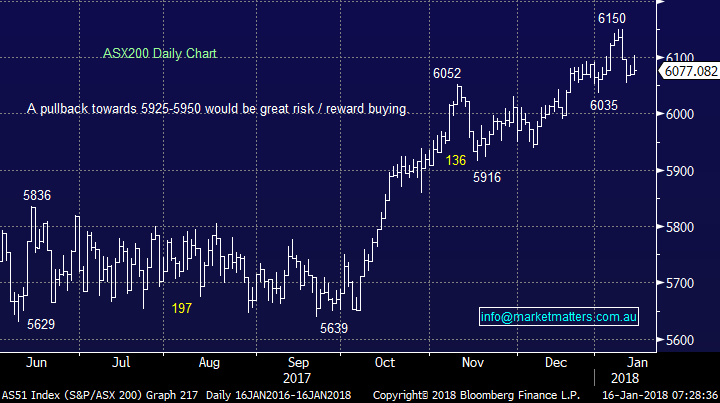
In our recent Outlook piece for 2018 MM forecast the $US would fall early in 2018 to fresh 3-year lows before rallying – this has unfolded perfectly to-date. Today we are going to take a close look at the $US market as we consider our the timing of our next moves across our portfolio’s. MM is currently sitting on a large cash position which still feels correct with the ASX200 looking to open below its 2017 close this morning. Purely on an index level we can see an initial test of the psychological 6000 area but an ultimate pullback to 5925-5950 would not surprise.
At MM we believe there has never been a more appropriate time to become a more active investor as both opportunities and traps will increase over the coming year(s). Simply some sectors will struggle in an environment where interest rates rise. Interestingly, we also see scope to expand the type of investments we make and will consider looking at holding some of our cash in $US rather than the $AUD if the US currency tests our downside targets. This is a relatively simple process simply buying US Dollars through as ASX listed ETF. We’ll cover more on this in time.
ASX200 Daily Chart
The $US Index
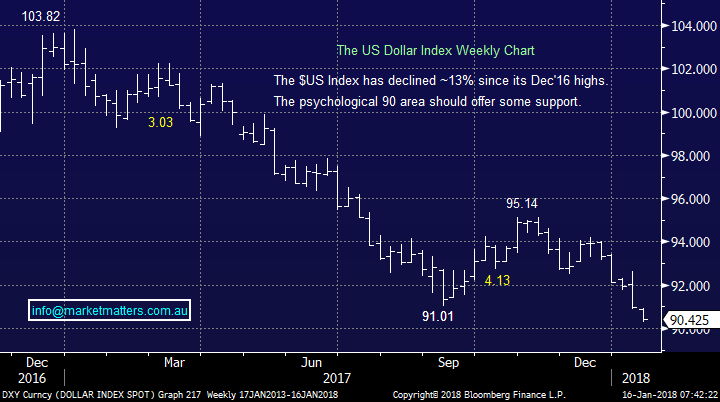
The $US has broken down towards the 90 area as we anticipated, taking gold and most $US denominated commodity prices higher. The obvious question for us is where do we expect it to stop?
- The weekly trendline support comes in around the 86-87 region.
- The last major monthly pullback was around 2010 and was 16-points, which would target ~88.
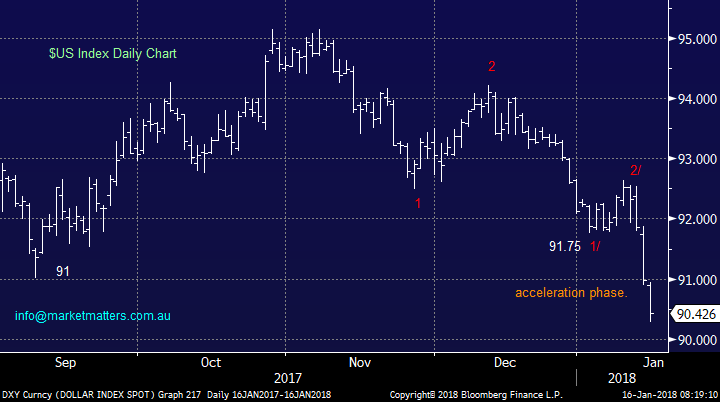
- The daily picture, which is accelerating lower, targets the mid-high 80’s region.
- Gold seasonally is usually strong from now until the end of February.
Conclusion on $US:
While the $US Index remains below 91.8 we expect a test of 86-88, however note gold / resources may top out before the final low in the $US depreciation.
$US Index Weekly Chart
$US Index Daily Chart
Gold seasonality Chart
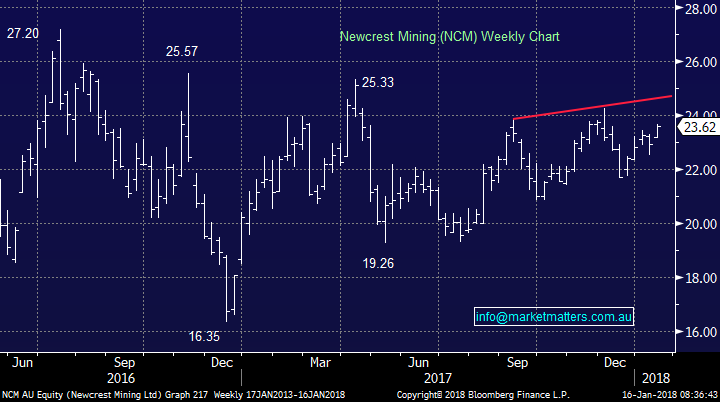
Newcrest Mining (NCM) $23.62
At MM we have a 7.5% portfolio weighting in Newcrest Mining (NCM), a position which is now showing us a small paper profit after putting us under pressure in December.
We are currently planning to sell our NCM position ~$25 over the coming weeks, ideally in line with the $US falling towards the 86-88 area.
However due to the relatively large position in what we determine as a more active portfolio stock, we may consider selling in 2 tranches.
Newcrest Mining (NCM) Weekly Chart
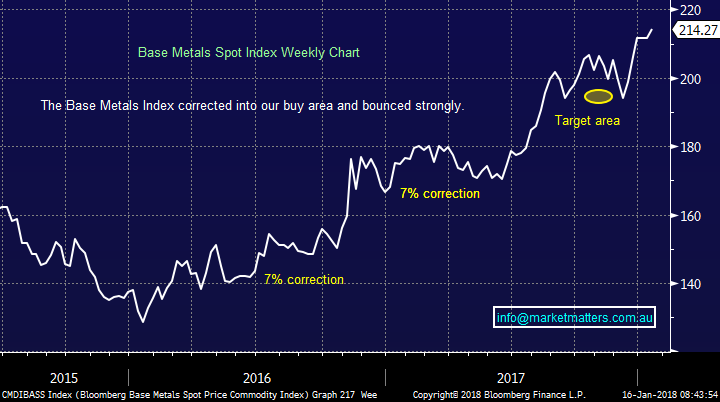
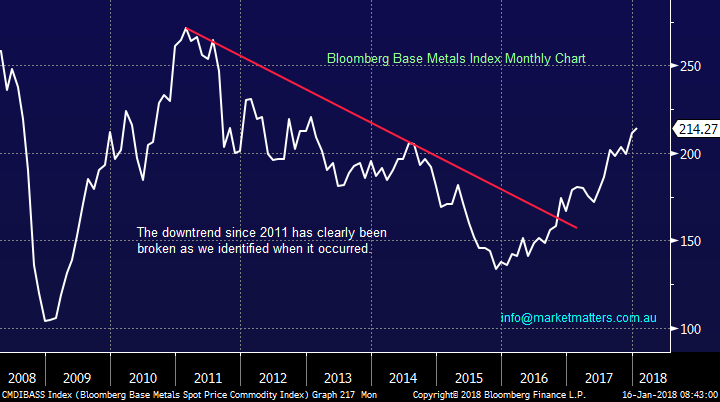
Base Metals
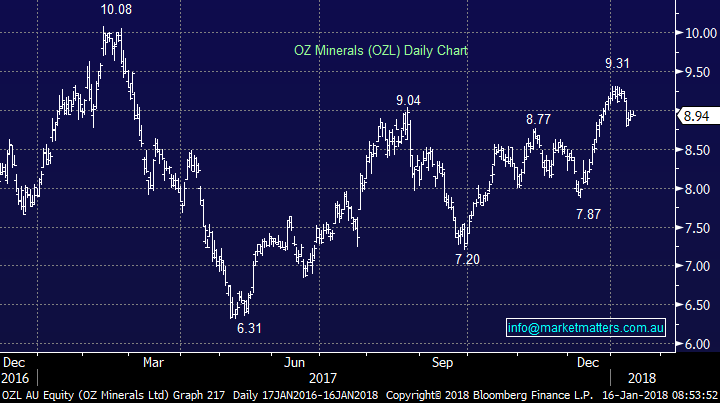
As touched on earlier, cyclical stocks usually outperform when interest rates rise and this has clearly been evident with the base metals which have rallied strongly since early 2016. We’ve made no effort to hide our plan to again establish a position in this sector via the likes of BHP and OZ Minerals (OZL). However it’s important to remember these are volatile stocks and trade location can have an enormous impact on our degree of comfort with a holding. Let’s just consider OZL during a bullish 2017:
- OZL corrected 37% Feb-May, 20% Aug-Sept and 10% Oct-Dec.
These numbers would certainly have created pain for investors who chased strength in the stock. Currently everyone’s bullish stocks / resources, if we experience just a question of this view by the market it could easily lead to a sharp 20% correction – its already fallen 5.7% from this month’s high and resources have been strong.
Conclusion
We plan to buy resource stocks in 2018 but are not comfortable chasing at current levels.
Bloomberg Base Metals Weekly Chart
Bloomberg Base Metals Monthly Chart
OZ Minerals (OZL) Daily Chart
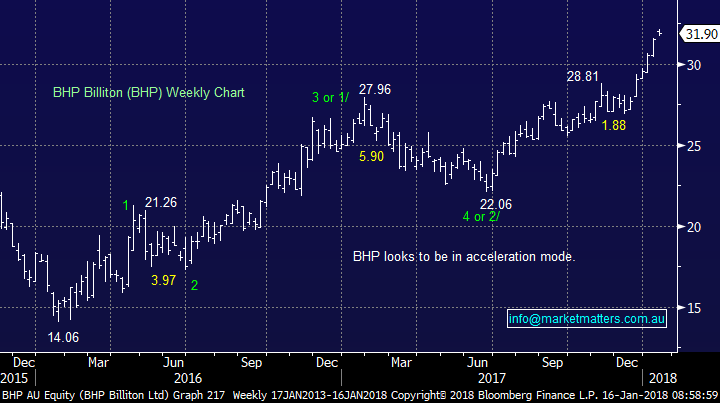
BHP Billiton (BHP) $31.90
We are keen on BHP in 2018 from both a bottom up valuation and technical perspective.
The stock has obviously been very strong, and we’re reluctant to chase at current levels, however we will review on a move back below $31 with the view of purchasing small quantities into weakness.
BHP Billiton (BHP) Weekly Chart
Conclusion
MM anticipates a few more weeks weakness in the $US followed by a decent correction, this is likely to create a correction in gold / resource stocks hence we have no interest chasing strength in this sector.
Global markets
US Stocks
Closed for Martin Luther King Day.
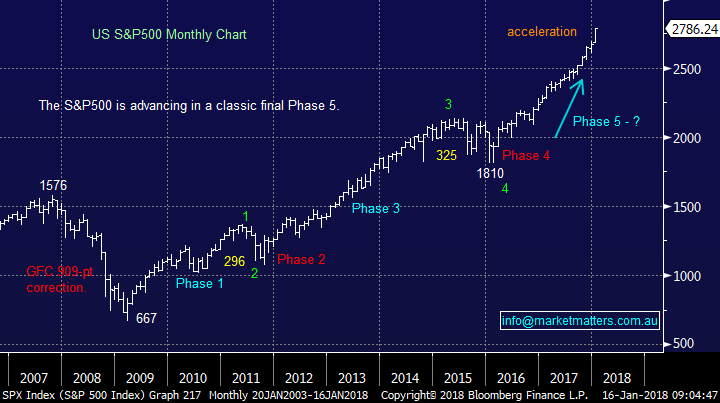
US S&P500 Monthly Chart
European Stocks
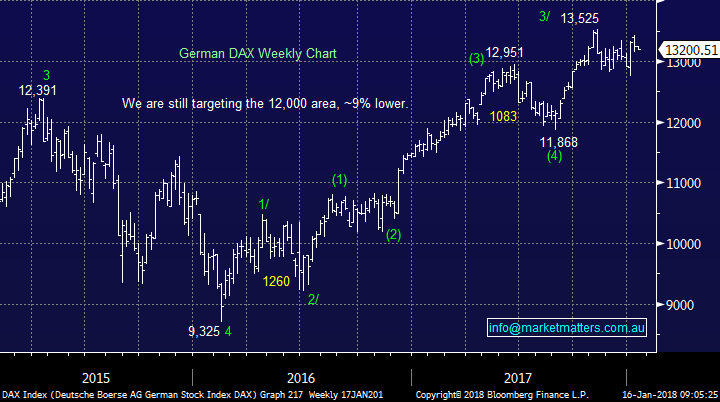
European stocks look set to make fresh recent highs the big question is will they fail or kick on. At this stage we are sitting on the fail side but only just!
German DAX Weekly Chart
Overnight Market Matters Wrap
· The major Euro regions closed marginally lower, whilst the US equity markets were closed overnight.
· In the commodities front, gold and oil continued higher, while iron ore traded lower.
· A soft and marginal open is expected in the ASX 200 this morning, still testing the 6080 level as indicated by the March SPI Futures.
Disclosure
Market Matters may hold stocks mentioned in this report. Subscribers can view a full list of holdings on the website by clicking here. Positions are updated each Friday, or after the session when positions are traded.
Disclaimer
All figures contained from sources believed to be accurate. Market Matters does not make any representation of warranty as to the accuracy of the figures and disclaims any liability resulting from any inaccuracy. Prices as at 16/01/2018. 8.00AM.
Reports and other documents published on this website and email (‘Reports’) are authored by Market Matters and the reports represent the views of Market Matters. The MarketMatters Report is based on technical analysis of companies, commodities and the market in general. Technical analysis focuses on interpreting charts and other data to determine what the market sentiment about a particular financial product is, or will be. Unlike fundamental analysis, it does not involve a detailed review of the company’s financial position.
The Reports contain general, as opposed to personal, advice. That means they are prepared for multiple distributions without consideration of your investment objectives, financial situation and needs (‘Personal Circumstances’). Accordingly, any advice given is not a recommendation that a particular course of action is suitable for you and the advice is therefore not to be acted on as investment advice. You must assess whether or not any advice is appropriate for your Personal Circumstances before making any investment decisions. You can either make this assessment yourself, or if you require a personal recommendation, you can seek the assistance of a financial advisor. Market Matters or its author(s) accepts no responsibility for any losses or damages resulting from decisions made from or because of information within this publication. Investing and trading in financial products are always risky, so you should do your own research before buying or selling a financial product.
The Reports are published by Market Matters in good faith based on the facts known to it at the time of their preparation and do not purport to contain all relevant information with respect to the financial products to which they relate. Although the Reports are based on information obtained from sources believed to be reliable, Market Matters does not make any representation or warranty that they are accurate, complete or up to date and Market Matters accepts no obligation to correct or update the information or opinions in the Reports.
If you rely on a Report, you do so at your own risk. Any projections are estimates only and may not be realised in the future. Except to the extent that liability under any law cannot be excluded, Market Matters disclaims liability for all loss or damage arising as a result of any opinion, advice, recommendation, representation or information expressly or impliedly published in or in relation to this report notwithstanding any error or omission including negligence.
To unsubscribe. Click Here


