The $US Drifts and Resources Roar!
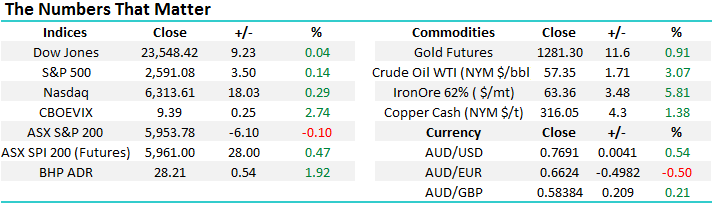
The local market has continued to grind higher with only the influential banking sector restraining the gains – over the last 5-days banks are down -3.6% courtesy of pretty average reports from CYB Plc (CYB), NAB (NAB) and Westpac (WBC). However over the same period, with the exception of discretionary retailers, every sector has advanced and today the resources are poised to take the ASX200 to fresh multi-year highs – we have 12.5% of the MM Growth Portfolio in resources but it’s never enough when they surge overnight!
As subscribers know we remain bullish stocks into 2018 but are wary of November’s seasonal volatility / weakness i.e. an average pullback of ~5% occurs within the month. Despite November’s common shenanigans there is no change to our overview, following Octobers 4% surge we remain bullish the local market, especially with the resources sector regaining its mojo which has more than offset the recent weakness within our banks.
• We remain bullish the ASX200 into 2018 targeting a solid break over 6000, clearly close now.
• We would need a break back under 5800 to lose this short-term bullish outlook.
• We are not surprisingly keen buyers of any weakness this month.
Both portfolios are around 90% invested in the market and hence will also be very prepared to take profits on our positions if they reach our target areas.
ASX200 Daily Chart
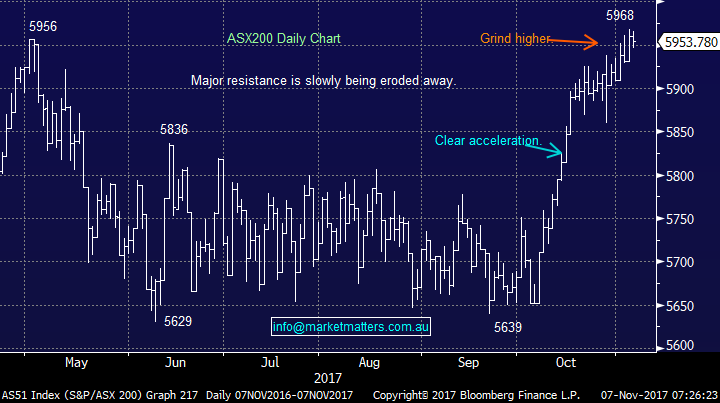
The $US drifts
The inverse correlation between the $US and the price of commodities is significant and was illustrated perfectly last night when the $US Index drifted lower, -0.2% away from the 95 area, helping a “pop” effect for a number of resources:
• Good examples were Gold +1%, Oil +3%, Coper +1.5%, and iron Ore +5.8%.
• Obviously there were a number of additional influential factors across the commodities spectrum but the common denominator providing strong support was a weak $US.
Obviously a small move of -0.2% in the $US is not significant but we feel the market has voted that the +4.5% advance since early September may have run its course with bullish implications for resources. Today we have briefly looked at 5 influential commodities and some of their relevant stocks – Gold, Oil, Copper and Iron Ore.
The $US Index Weekly Chart
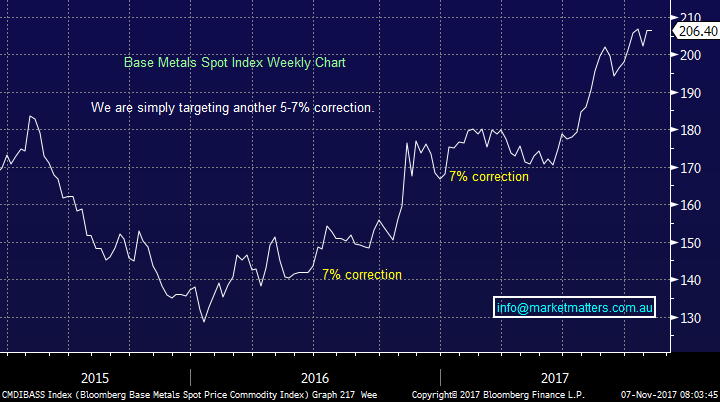
We remain bullish the reflation trade into 2018 and obviously wish we had a portfolio exposure closer to ~20% than our 12.5% in the MM Growth Portfolio given the anticipated strength in resources this morning – in hindsight we may have been too fussy with Oz Minerals (OZL). However base metals are a volatile beast and decent corrections are not uncommon, the index has recently fallen 7% twice in less than 2-years. We still believe that from a risk / reward perspective this is not an optimum time to chase stocks, especially the broad market.
Base Metals Spot Index Weekly Chart
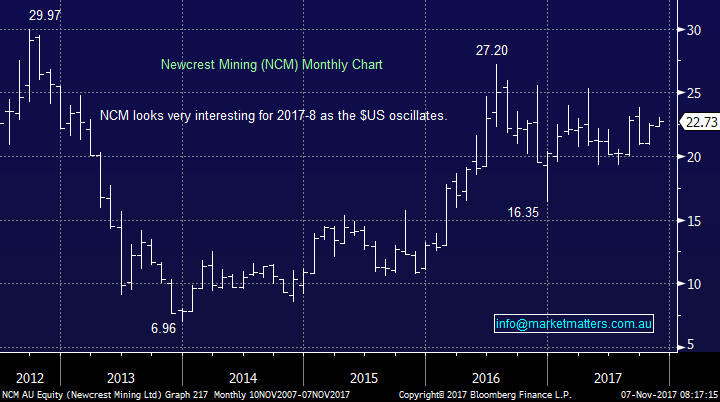
1 Gold
Overnight gold ETF’s generally rallied ~2% which should provide a strong platform for local gold stocks this morning. We currently hold 7.5% of the MM Growth Portfolio in NCM, a position which is likely to be around square today after being down close to 10% last month – resources are not for the fainthearted!
We believe NCM can challenge ~$25 in the coming months, especially if the $US challenges fresh 2017 lows – we are very likely to take profit if this eventuates.
Newcrest Mining (NCM) Monthly Chart
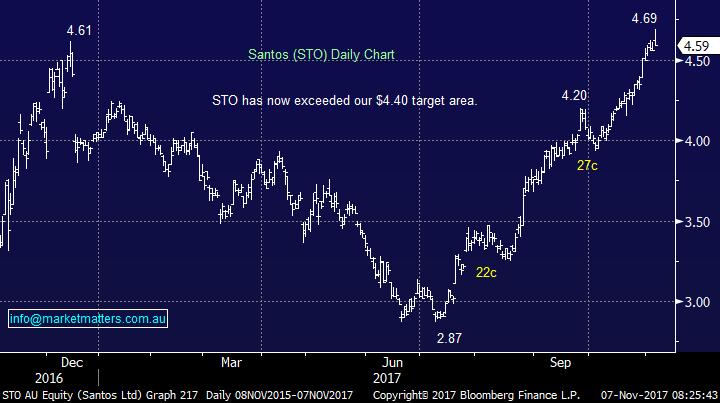
2 Crude Oil
Last night crude oil surged over 3% to fresh 2-year highs totally reaffirming our bullish outlook for the sector.
We previously had a trading target of ~$4.40 for Santos when we went long under $4 last month – not bullish enough!
We are now targeting ~$5.40, significantly higher and will be looking for another 25c correction to go long for a trading position in STO.
Santos (STO) Daily Chart
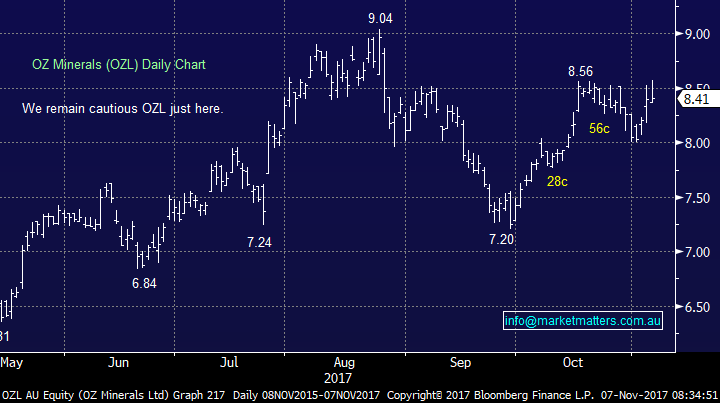
3 Copper
Copper continues to oscillate between $US310-320/oz. leaving us neutral at present but with a positive bias due to the overall base metal complex. Oz Minerals (OZL) is likely to break over $8.60 today hitting our initial target but now leaving us neutral.
OZ Minerals (OZL) Daily Chart
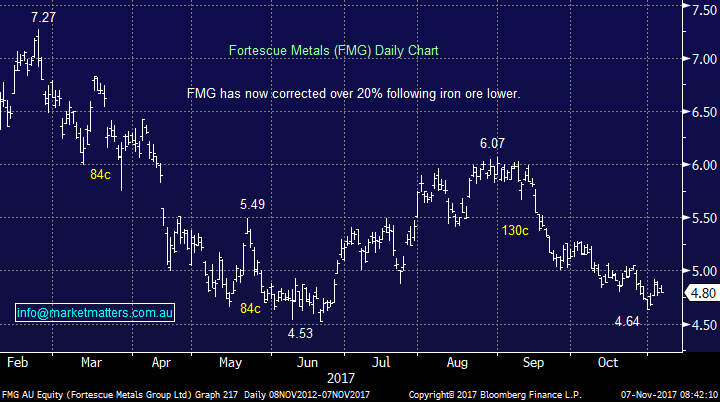
4 Iron Ore
Iron ore bounced 5.8% in the US last night but it was already up 3.6% in China hence not quite as dramatic as first glance. However, FMG is likely to bounce further today towards $5 but we remain neutral, although importantly not negative as in the past.
Fortescue Metals (FMG) Daily Chart
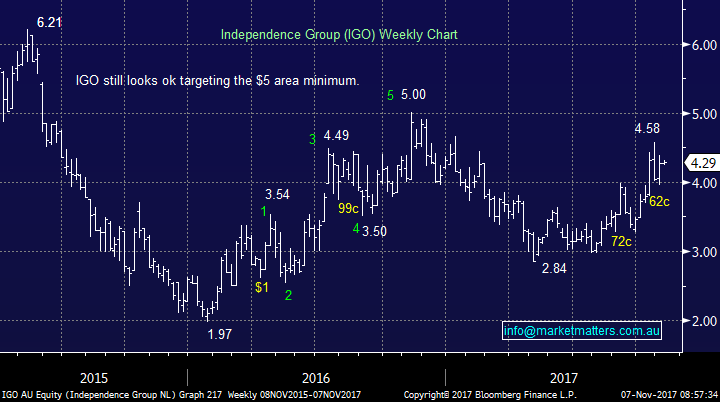
5 Nickel
We are long the volatile IGO from just below yesterdays close. We can a see a squeeze in IGO well over $5 and remain comfortable our position – subscribers please note this is a volatile beast!
Independence Group (IGO) Weekly Chart
Global markets
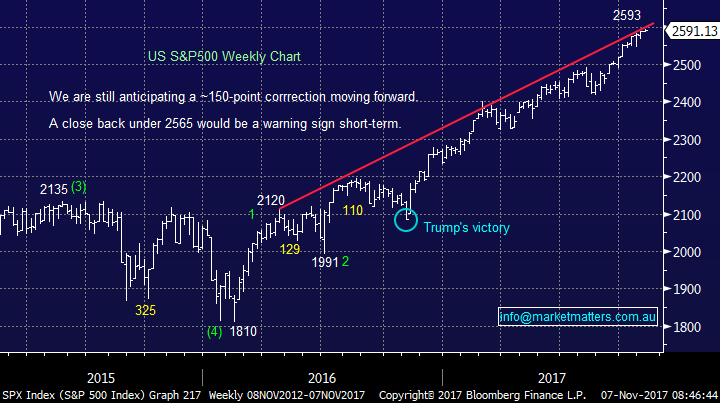
US Stocks
The US continues to oscillate around all-time highs and although we need a ~5% correction to provide a decent risk / reward buying opportunity, no sell signals have been generated to-date.
US S&P500 Index Weekly Chart
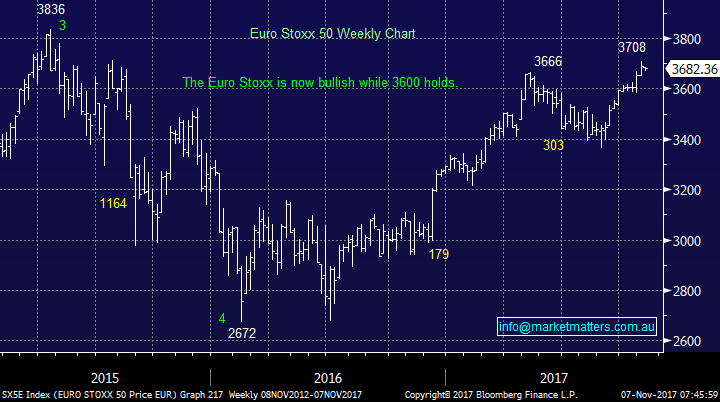
European Stocks
European stocks have broken out to fresh 2017 highs and are now bullish technically while the 3600 area holds i.e. ~2.2% lower.
Euro Stoxx 50 Weekly Chart
Conclusion (s)
We remain bullish the “reflation trade” into 2018 with 2 trading / investing thoughts as below:
1. We are sellers of NCM around the $25 area.
2. We are buyers of a 25c pullback in Santos (STO).
Overnight Market Matters Wrap
• The US share markets hit all-time highs as Broadcom bid $US105B for Qualcomm in what would be the biggest ever deal for the technology sector.
• Oil rallied 3% to its highest level in two years as Saudi Arabia cracked down on corruption in the kingdom.
• Most metals on the LME were better with nickel ahead 1.5%, while gold is trading higher and iron ore has spike close to 6%.
• The December SPI Futures is indicating the ASX 200 to open 30 points higher towards the 5980 area this morning.
Disclosure
Market Matters may hold stocks mentioned in this report. Subscribers can view a full list of holdings on the website by clicking here. Positions are updated each Friday, or after the session when positions are traded.
Disclaimer
All figures contained from sources believed to be accurate. Market Matters does not make any representation of warranty as to the accuracy of the figures and disclaims any liability resulting from any inaccuracy. Prices as at 07/11/2017. 8.00AM.
Reports and other documents published on this website and email (‘Reports’) are authored by Market Matters and the reports represent the views of Market Matters. The MarketMatters Report is based on technical analysis of companies, commodities and the market in general. Technical analysis focuses on interpreting charts and other data to determine what the market sentiment about a particular financial product is, or will be. Unlike fundamental analysis, it does not involve a detailed review of the company’s financial position.
The Reports contain general, as opposed to personal, advice. That means they are prepared for multiple distributions without consideration of your investment objectives, financial situation and needs (‘Personal Circumstances’). Accordingly, any advice given is not a recommendation that a particular course of action is suitable for you and the advice is therefore not to be acted on as investment advice. You must assess whether or not any advice is appropriate for your Personal Circumstances before making any investment decisions. You can either make this assessment yourself, or if you require a personal recommendation, you can seek the assistance of a financial advisor. Market Matters or its author(s) accepts no responsibility for any losses or damages resulting from decisions made from or because of information within this publication. Investing and trading in financial products are always risky, so you should do your own research before buying or selling a financial product.
The Reports are published by Market Matters in good faith based on the facts known to it at the time of their preparation and do not purport to contain all relevant information with respect to the financial products to which they relate. Although the Reports are based on information obtained from sources believed to be reliable, Market Matters does not make any representation or warranty that they are accurate, complete or up to date and Market Matters accepts no obligation to correct or update the information or opinions in the Reports.
If you rely on a Report, you do so at your own risk. Any projections are estimates only and may not be realised in the future. Except to the extent that liability under any law cannot be excluded, Market Matters disclaims liability for all loss or damage arising as a result of any opinion, advice, recommendation, representation or information expressly or impliedly published in or in relation to this report notwithstanding any error or omission including negligence.
To unsubscribe. Click Here


