The market “bets” Trump is bluffing!
Yesterday’s local trade certainly tested my short-term bullish outlook for stocks i.e. a decent rally into March / April given the grind lower / distinct void of buying throughout the session. The local market fell away all day with weakness from BHP to CBA but it was the unexpected weakness from our local banks that had me scratching away the little hair I have left on my head. This morning as I type this report the Dow is up close to 400-points and the SPI futures are implying the ASX200 will open up around 70-points / 1.2%, I feel redeemed at least for now! All 10 of the S&P500 sectors are up strongly with the important financials up +1.9% implying that an opening back above 5950 is far from too optimistic.
This morning I thought I would have a quick look at the characteristics of trading within March since the GFC seeing as this one is trying hard to shake my bullish view:
- Since the GFC the low for March is on average around the 10th.
However there is no standout correlation with the lows coming in almost random fashion between the 1st and 22nd, hence we feel there are no useful statistics of note – this should really be of no surprise as the short-term swings in markets are generally random in nature and news driven i.e. Mt Trumps domain!
Todays report is going to focus on a Exchange Traded Funds (ETF’s), a vehicle we can see ourselves using when MM believes it’s time to exit / short equities.
We have had numerous requests about how they work so I thought this was an opportune time to at least commence the education / explanation so there are no sudden surprises when they pop up on your phones, in alerts, over the coming weeks / months. We will expand on this in coming reports, including this week’s Income Report with a focus on Income producing ETFs.
Local Index
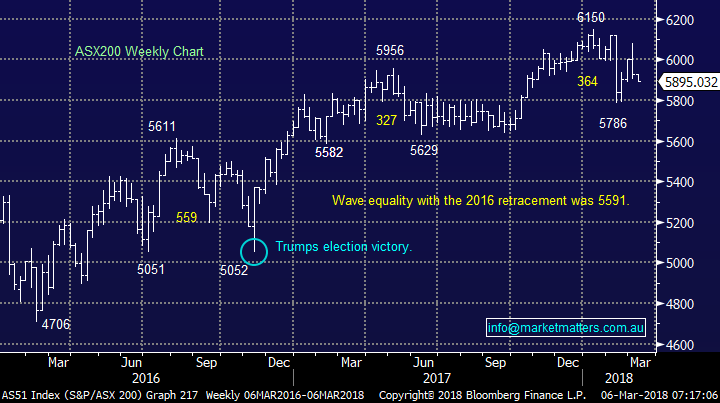
Yesterday the ASX200 closed down -0.57% as it fed on negative press around Trumps tariffs and China / Hong Kong’s debt burden. However the volume was pretty low and it felt like a lack of brave buyers as opposed to aggressive sellers which was understandable as the US futures were falling during most of our session.
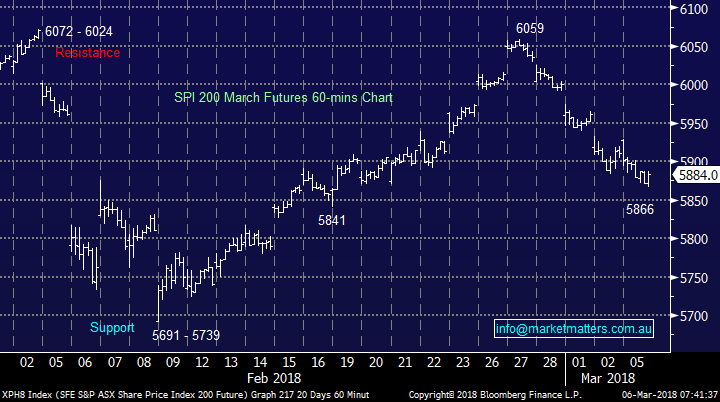
For the mathematicians out there the SPI Futures (basically the ASX200 taking into account dividends) is forming a perfect normal distribution / Neutral Pattern from 5691 to 6072, if we get a break over 6072 from a trading perspective we could be buyers with stops under 6020.
This morning the SPI futures are implying an ASX200 open ~5965, - we remain bullish the ASX200 targeting 6250-6300 area.
ASX200 Chart
ASX200 March SPI futures 60-mins Chart
US Stocks
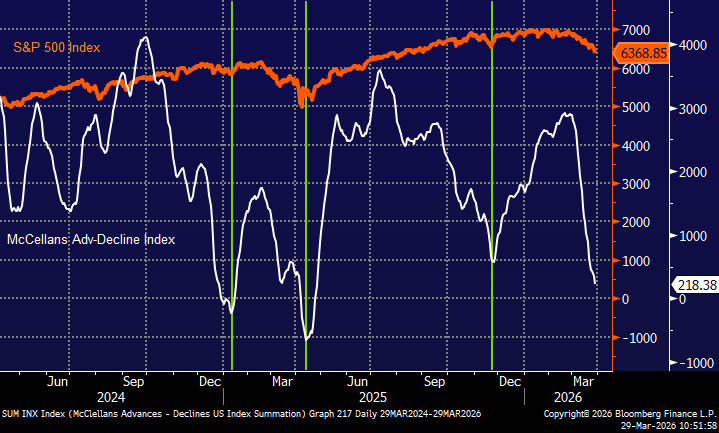
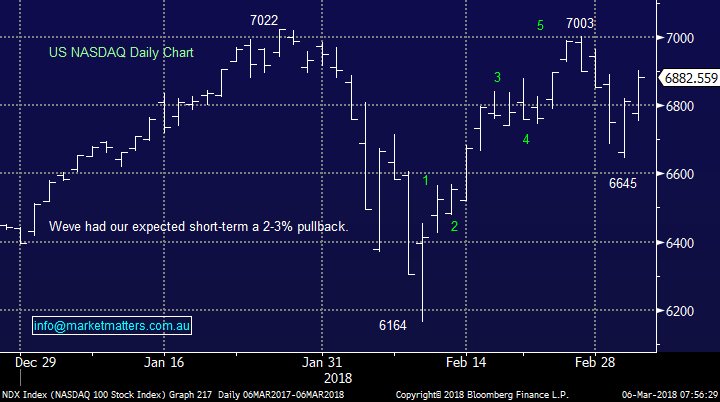
US stocks experienced the ~3% pullback we flagged last week and ideally are in the process of commencing a rally to fresh all-time highs – the high flying NASDAQ which we believe regularly leads global indices is currently only 2% below its all-time high – pretty good effort considering what’s been thrown at it since February e.g. rallying bond yields, a volatility implosion and Donald Trump threatening trade wars.
NB also the S&P500 has closed only 0.1% below its high for March, another statistically very bullish indicator.
US NASDAQ Chart
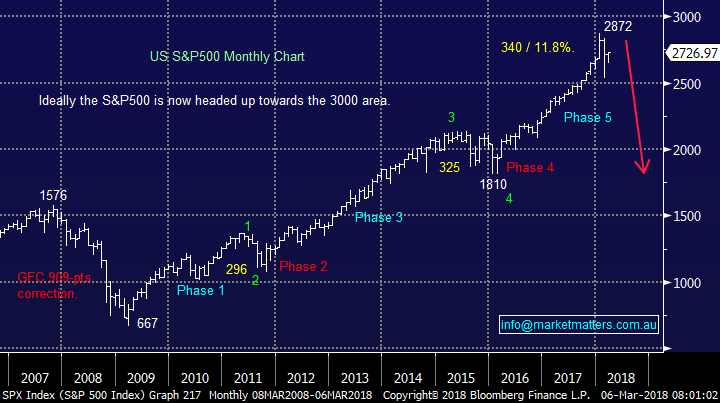
Subscribers must remember our longer-term view that stocks are getting ready for a meaningful +20% correction – a fantastic opportunity for the prepared
US S&P500 Chart
Bearish Exchange Traded Funds (ETF’s)
Firstly, we don’t believe that bearish ETF’s are solely for the “traders” out there, instead we think they have a wider use from a risk management perspective for longer term investors. Using a holding in CBA as an example which has a high correlation to the index, and assuming an investor has a desire to hold for the longer term, or perhaps a reluctance to sell given tax ramifications, how can the capital value of that position be protected during a 20% correction in markets? The simple answer is through a hedge, and there are many ways to ‘hedge’ a position or a portfolio. ETFs are simply one of them, but a good one at that in our view.
Today we have covered 2 ETF’s keeping things deliberately simple in the initial stages – apologies if I bore come readers however in fairness, there is no need to complicate ETF’s, they are a pretty simple vehicle.
1 Bearish exposure to Australian Stocks
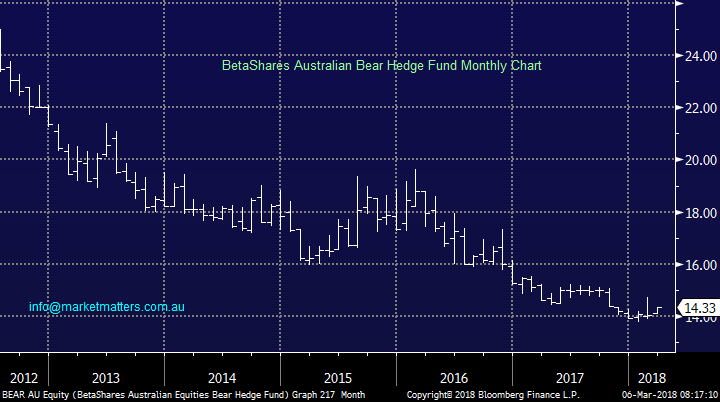
The BetaShares Bear Fund (BEAR) illustrated below is structured to make money from a declining local market i.e. its negatively correlated to the ASX200. Hence as we can see below the ETF has fallen since 2012 while the ASX200 has rallied from around 4000 to almost 6000.
Some Important points to consider in this basic explanation:
- The inverse correlation is not perfect due to external factors like dividends / interest rates / daily ranges but its close enough to serve its purpose. To be accurate, it has historically provided a -0.96 correlation to the ASX 200.
- The ETF is traded on the ASX just like BHP and CBA under code BEAR.AXW
- This fund has no leverage hence if we assume a $100k portfolio, we would need to buy ~$100k worth of the BEAR.AXW
The correlation is pretty good i.e. if the ASX200 rallied +30.7% from its 2016 lows, plus of course paying some dividends, over the same time the ETF fell -29.7% - close enough for us but note there will always be a small degree of tracking error / -0.96
If the ASX200 rallies towards 6250-6300 in March / April we can see ourselves increasing our cash level to say 60% and allocating 10% into this BEAR which would give us theoretically only a ~30% exposure to the local market.
In the coming days we will look at a leveraged version of this BEAR plus an ETF on the $US.
BetaShares Australian Bear Fund (BEAR) Chart
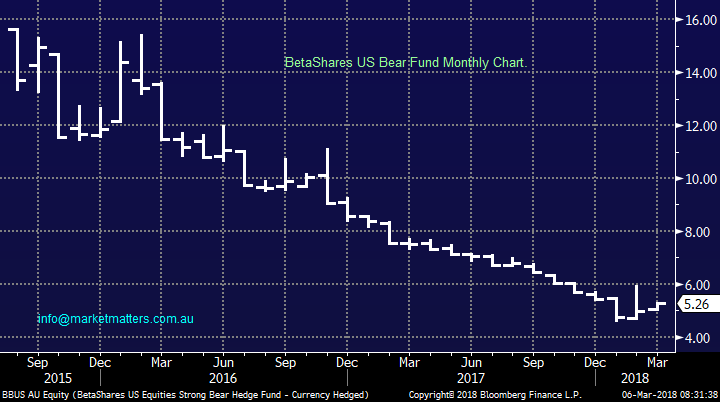
2 Bearish ‘leveraged’ exposure to US Stocks
Similar to the Australian version BetaShares offer an equivalent to gain negative exposure to US stocks whether for speculation or hedging, however this is a leveraged version, so slightly more complicated.
The important points to consider:
- The inverse correlation is magnified due to leverage and this means it’s not perfect, but again its close enough to the serve its purpose.
- Again the ETF is traded on the ASX just like BHP and CBA under code BBUS.AXW
- This fund has gearing so the following calculations would apply; Put simply, if the:
· - S&P 500 moves up 1% in USD terms on a day
- the Fund is expected to move down between -2.0% and -2.75% in AUD terms
· - S&P 500 moves down -1% in USD terms on a day
- the Fund is expected to go up between 2.0% to 2.75% in AUD terms
- The fund is hedged to Australian dollars hence you are buying an $A denominated asset on the ASX.
BetaShares US Bear Fund (BBUS) Chart
At this juncture, Betashares are the only provider of ‘negative’ facing ETF’s in Australia that I can see (please correct me if I’m wrong) and as such they have the market tied up. It will be interesting to see if any of the other players will hit the boards if market volatility starts to tick up.
Conclusion
- We remain bullish stocks into April / May but be prepared for increasing volatility as market looks for a top.
- We anticipate using at least one of the above ETF’s to gain some negative exposure to stocks over the coming months.
Global markets
US Indices
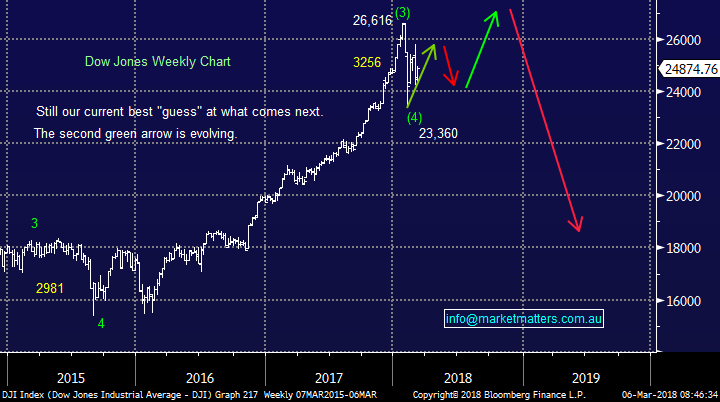
No major change, overall we believe US stocks have formed a low and they will be higher in 1-2 months’ time.
- While we expect US stocks to rally to fresh highs the likely manner of the advance is far more choppy / indecisive than the almost exponential gains we have witnessed from late 2016.
US Dow Jones Chart
European Stocks
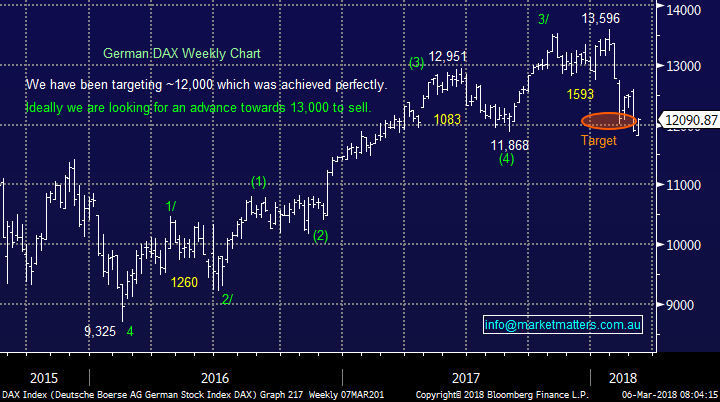
European indices have been lagging since late January but last night they rallied strongly, potentially we’ve seen their low for a few months.
German DAX Chart
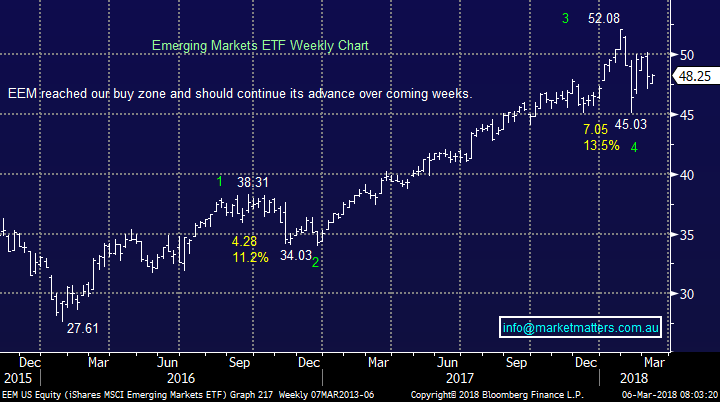
Asian Stocks / Emerging Markets
Further consolidation by the Emerging Markets in this current area adds weight to our view that a final pop ~10% higher is a strong possibility in March / April – also this adds weight to our preferred scenario that the $US can see one final low in the coming weeks.
The Emerging Markets (EEM) Chart
Overnight Market Matters Wrap
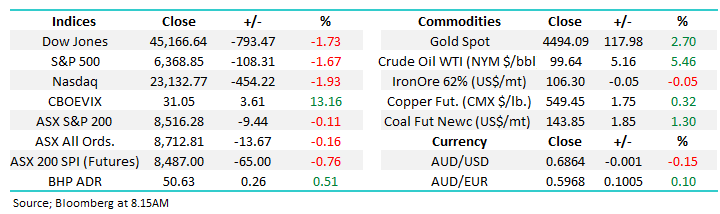
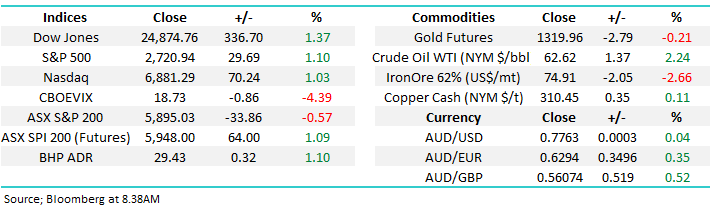
· The US started its week on a positive note, with the major indices rallying over 1% overnight, led by the Dow as the recent talks by the US President and a ‘war trade’ to erupt dissipated swiftly.
· Locally, investors will focus on the macro events, as the RBA meet this afternoon where most anticipate no rate change.
· The March SPI Futures indicating the ASX 200 to open 66 points higher this morning, towards the 5960 level this morning.
Disclosure
Market Matters may hold stocks mentioned in this report. Subscribers can view a full list of holdings on the website by clicking here. Positions are updated each Friday, or after the session when positions are traded.
Disclaimer
All figures contained from sources believed to be accurate. Market Matters does not make any representation of warranty as to the accuracy of the figures and disclaims any liability resulting from any inaccuracy. Prices as at 06/03/2018. 8.13AM
Reports and other documents published on this website and email (‘Reports’) are authored by Market Matters and the reports represent the views of Market Matters. The MarketMatters Report is based on technical analysis of companies, commodities and the market in general. Technical analysis focuses on interpreting charts and other data to determine what the market sentiment about a particular financial product is, or will be. Unlike fundamental analysis, it does not involve a detailed review of the company’s financial position.
The Reports contain general, as opposed to personal, advice. That means they are prepared for multiple distributions without consideration of your investment objectives, financial situation and needs (‘Personal Circumstances’). Accordingly, any advice given is not a recommendation that a particular course of action is suitable for you and the advice is therefore not to be acted on as investment advice. You must assess whether or not any advice is appropriate for your Personal Circumstances before making any investment decisions. You can either make this assessment yourself, or if you require a personal recommendation, you can seek the assistance of a financial advisor. Market Matters or its author(s) accepts no responsibility for any losses or damages resulting from decisions made from or because of information within this publication. Investing and trading in financial products are always risky, so you should do your own research before buying or selling a financial product.
The Reports are published by Market Matters in good faith based on the facts known to it at the time of their preparation and do not purport to contain all relevant information with respect to the financial products to which they relate. Although the Reports are based on information obtained from sources believed to be reliable, Market Matters does not make any representation or warranty that they are accurate, complete or up to date and Market Matters accepts no obligation to correct or update the information or opinions in the Reports.
If you rely on a Report, you do so at your own risk. Any projections are estimates only and may not be realised in the future. Except to the extent that liability under any law cannot be excluded, Market Matters disclaims liability for all loss or damage arising as a result of any opinion, advice, recommendation, representation or information expressly or impliedly published in or in relation to this report notwithstanding any error or omission including negligence.
To unsubscribe. Click Here