The clash of the titans escalates, hold on tight! (RMB, VIX, RIO, BBOZ, NCM)
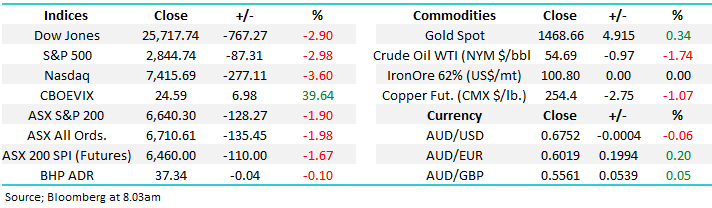
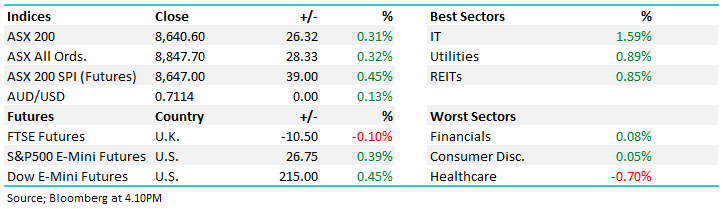
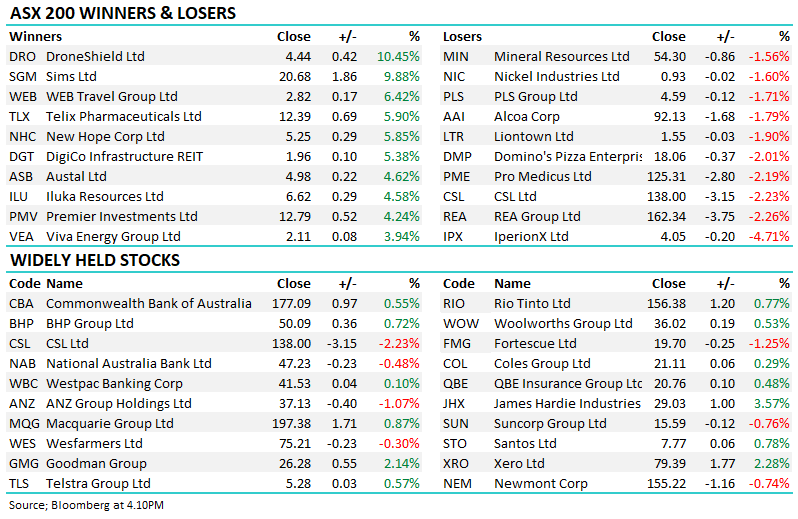
The ASX200 came down to earth with a crash yesterday falling 128-points / 1.9% as almost panic selling resonated through global markets, the rest of Asia followed suit and at 9pm last night Europe was also falling by the same degree. Locally the “risk on” stocks / sectors were punished the hardest with the IT sector the worst on ground falling by over 5% while the best performing sector was the Consumer Discretionary and it still fell by over 1% - a trend we expect to continue. Almost 90% of our market closed in the red with 10% of the ASX200 falling by over 5% while not one stock rallied by the same degree, basically there was very little green on the screen outside of the gold sector - no more need be said, a shocking day with more to follow this morning.
Companies reporting results today: SCP, BWP, CMA

China has sparked pandemonium on 2 very disturbing fronts:
1 – The PBOC let its currency plunge ~1.6% against the $US to its lowest level since the GFC sending a very clear & aggressive message to President Trump that the currency (Yuan) was their new weapon in the escalating trade war - a weak Yuan (RMB) is supportive of Chinese exports.
2 – Just for good measure China also instructed their state owned companies to hold back on buying U.S. agricultural products.
A Blomberg story this morning described China’s retaliation as 11 out of 10, we have to agree. I hate to be corny but I couldn’t resist typing my initial thought – “how on earth is Trump going to Trump that”. We made the following comment in the Weekend Report “this standoff feels likely to get far worse before it improves”, this is rapidly becoming MM’s understatement of the year.
I shouldn’t really be surprised by the escalation in volatility, the market seems to throw up this sort of action when I’m away. A reminder to all that myself and Harry are heading to the Flinders Ranges tomorrow for the APEX Postie Ride – the good news its we’ve raised nearly $30,000 for a great cause, however reports from Thursday morning to Monday will be short and sharp, and penned by Alex on the desk. There will be no Weekend Report on Sunday however reports will commence as usual on Monday. The timing clearly not ideal – good job it’s for a great cause.
Once again, thank you for the support - for those that need some further insight into the ride, here’s a quick YouTube clip of a past event: Click Here. For more information, or to donate, Click Here
Very importantly we want to assure MM subscribers that we aren’t just switching off the lights for a few days, Alex will remain on the desk for our clients and the team available on the phone for subscribers and most importantly, alerts will continue flow if further opportunities arise which seems possible
Not surprisingly MM remains comfortable adopting a more conservative stance than we did for the first half of 2019 but we do intend to be active this month.
Overnight US stocks were smashed as the China news was further digested by investors, the Dow tumbled 767-points / 2.9%. This morning the ASX200 is set to open down over 100-points but interestingly BHP only fell 8c, our purchase of RIO yesterday looks likely to open fine this morning implying the selling will be focused elsewhere, watch the IT sector.
Today we are again going to look at a few “ad hoc” situations unfolding in today’s market, especially as we plan to deploy some of our cash holding into weakness however its vital subscribers understand how we see this stock market correction unfolding in the weeks / months ahead.
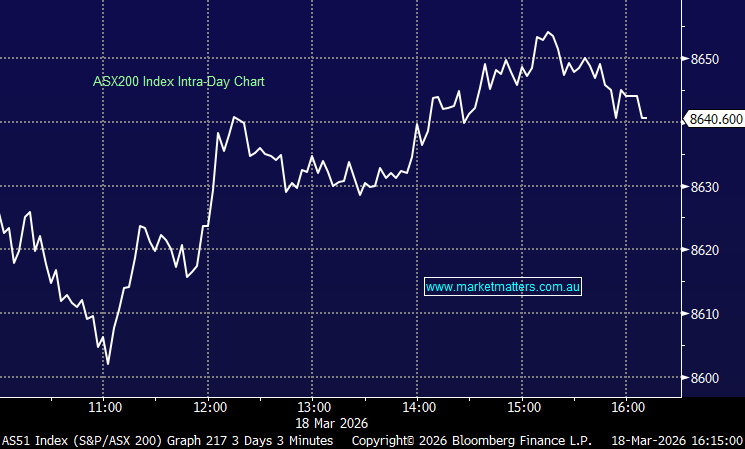
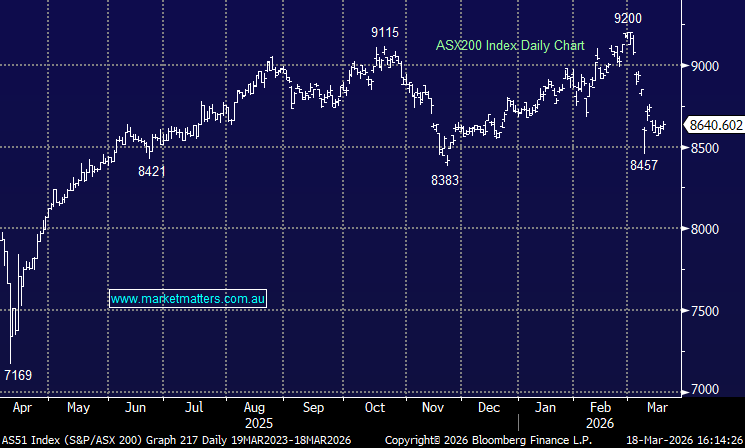
ASX200 Chart
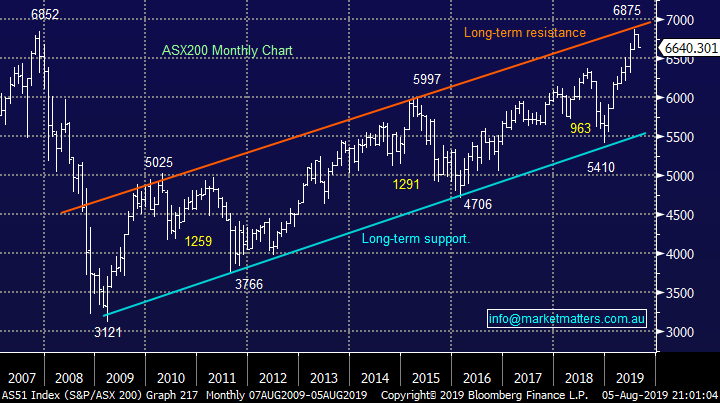
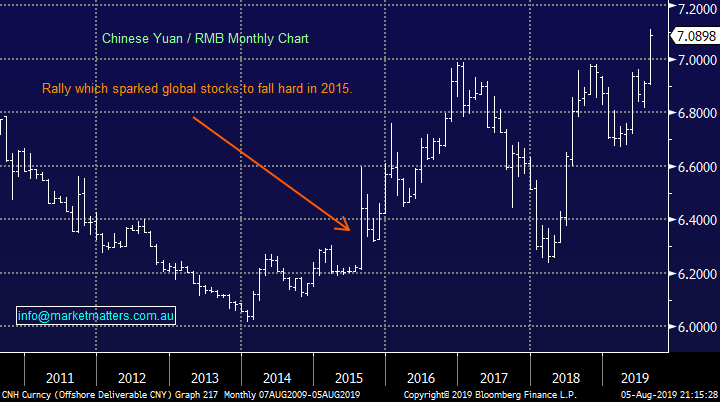
Yesterday China let its currency plunge to its lowest level against against the $US since the GFC i.e. the Greenback has surged to over 7 against the $US. The last time the market really panicked around China devaluing the Yuan was in August 2015, that month US stocks collapsed Almost 12% illustrating how important markets interpreted the move, to put things into perspective the S&P500 has only corrected 5.3% so far this month.
MM believes this is not the time to become a hero and aggressively pick the bottom too early.
Chinese Yuan (RMB) Chart
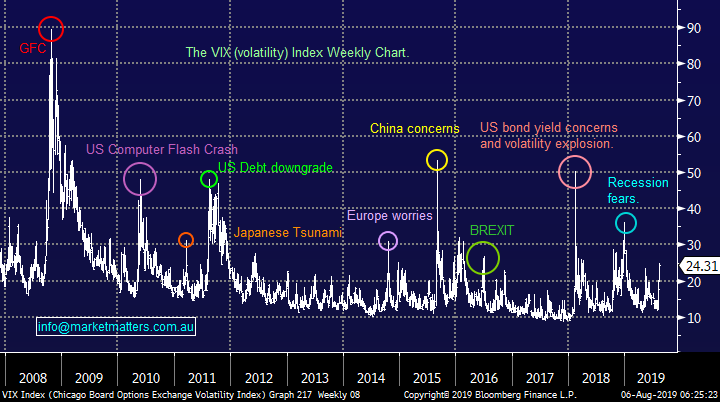
Overnight the VIX Volatility / Fear gauge surged almost 40%, a move we flagged recently due to the record short position being held by complacent investors / traders. However the VIX is still only trading at around half of the panic levels achieved back in 2015, any further momentum should at least challenge last Decembers panic sell-off lofty heights – as people cover short VIX positions they effectively sell S&P500 futures amplifying the downward spiral in stocks.
Volatility could easily squeeze higher this month but there will again be a great time to fade the move as interest rates remain extremely low- and likely to go lower.
Volatility Index (VIX) Chart
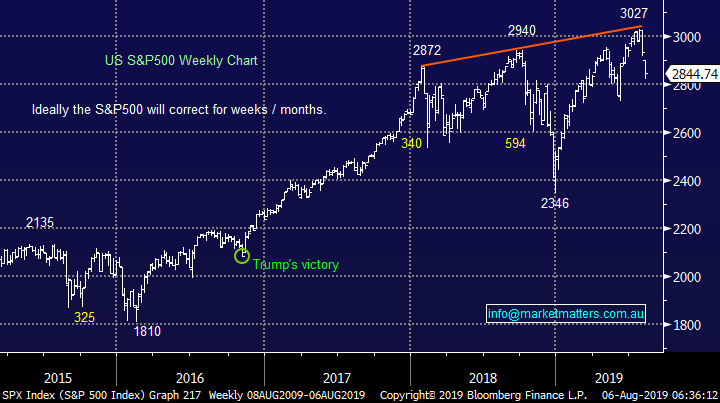
In yesterdays report we wrote “MM believes we have entered a new short-term cycle for US stocks where bounces should be sold for the active trader” to put things into perspective our preferred roadmap is as follows:
1 - Our initial target for this aggressive market correction is ~2750, now only around 3% lower.
2 – However this is likely to only be the initial leg lower, our ultimate target for this market pullback is ~2350, a retest of Decembers panic low – we certainly have real fundamental reasons to plumb these levels now.
These are exciting times, not ones to panic and runaway but its essential investors have a plan otherwise those dominant human emotions of “Fear & Greed” will wreak havoc with your returns.
Our initial target for this down leg in the S&P500 is 2750, or ~3% lower.
US S&P500 Chart
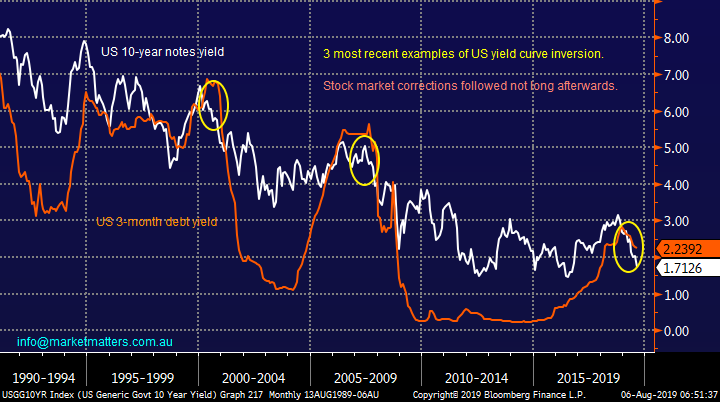
Overnight we saw the US yield curve inversion extend further as investors flocked to the safety of US 10-year treasuries – an excellent historical economic indicator of a looming recession.
The previous 2 times the yield curve inverted in such a manner equities experienced very meaningful corrections,
US “Yield Curve” Chart
MM’s plan for the weeks ahead.
As we said earlier a plan is vital for successful investing when event driven volatility simply goes bananas. Our plan is simple but will require some well-timed execution which is likely to see MM particularly active in the weeks ahead:
1 – We want to continue with a conservative bias until further notice e.g. today our Growth Portfolio holds 20% in cash and 10% exposure towards gold.
2 – US stocks are clearly the tail that’s wagging the dog and we are comfortable with our outlook here hence we will use them as an indicator in our actions across MM’s more active portfolios.
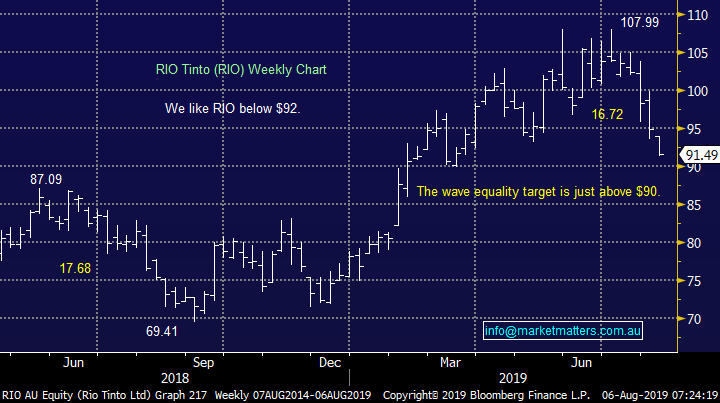
Firstly we bought RIO yesterday into its aggressive sell-off, importantly following our plan which has been laid out for weeks. Over recent sessions we have added Fortescue (FMG) and RIO Tinto (RIO) to the Growth Portfolio in a relatively small way, we intend to “top up” both holdings to ~5% into further weakness.
MM is looking to average RIO around $90, only 2% lower - this level is only appropriate before its dividend on Thursday.
RIO Tinto Ltd (RIO) Chart
Bearing in mind MM is currently holding 20% in cash below are the stocks we are considering both buying & selling / reducing plus importantly the respective levels, most of these have been flagged over the previous weeks:
Buying / accumulating
1 – Commonwealth Bank (CBA) $81.21: as discussed previously we like CBA around $80, or 1.5% lower.
2 – Bingo Industries (BIN) $2.23: we like BIN around $2.15, or around 3% lower – although prefer this after its report on the 21st August.
3 – RIO Tinto (RIO) $91.49 & Fortescue Metals (FMG) $7.09: we are looking to average as touched on earlier, both into fresh weekly lows – around $90 and below $7 respectively.
4 – Elders (ELD) $7.08: we have been targeting ELD around $7 and this level looks very attainable today, or in the near future.
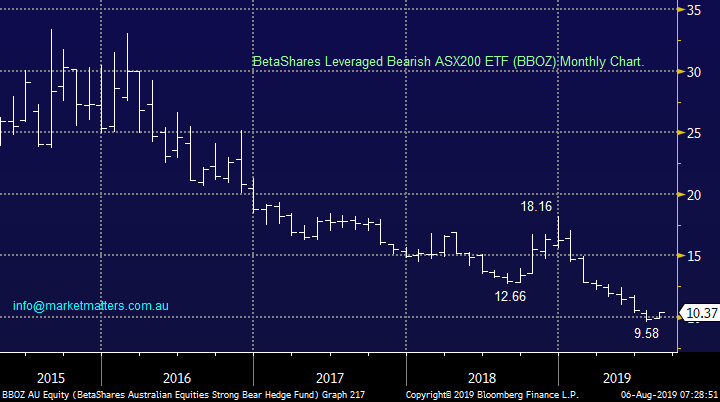
5 - BetaShares Leveraged Bearish ASX200 ETF (BBOZ) 10.37: A leveraged bearish / hedge for the ASX200 e.g. yesterday when the local bourse fell 1.9% the BBOZ rallied 4.4%. If the local index eventually tests its December lows, as we expect for US stocks, then this ETF should rally by ~80%.
Hence at MM we intend to buy / accumulate stocks into panic just as we expect this morning, while at the same time building a position in the BBOZ into bounces which will inevitably happen.
Our plans above may be too active for some subscribers, in which case patience is probably the best form of action. Importantly we have zero interest in the high value / momentum stocks which we believe could be hammered in the weeks ahead, when MM considers say Altium (APX) or Macquarie Bank (MQG) you know we feel the markets reaching a bottom.
BetaShares Leveraged Bearish ASX200 ETF (BBOZ) Chart
Selling / reducing
The below stocks are a mixture of losers, winners and simply areas where our exposure feels too large:
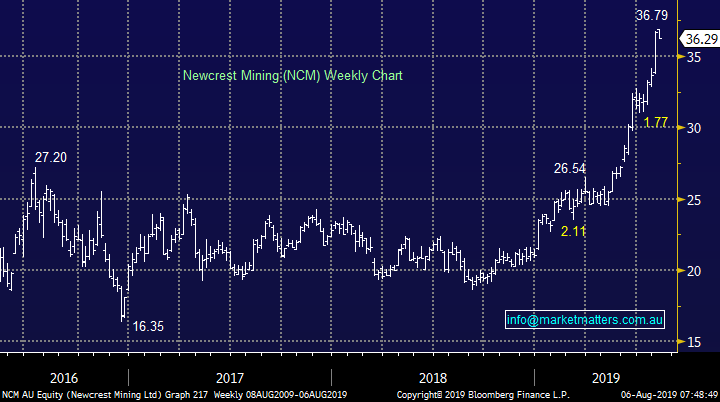
1 – Newcrest (NCM) $36.29: while we like the gold sector moving we are cognisant of both how far and fast they have risen plus the stock specific risk into reporting season. Overnight the GDX gold ETF rallied 3% but it finished mid-range on the night while gold only rallied $US19 as the DOW melted over 800-points at one stage, gold feels tired. We think it’s time to take our $$ on NCM while looking to regain exposure to the gold sector in the weeks ahead.
2 – Commonwealth Bank (CBA) $81.21 & Bank of Queensland Bank of Queensland (BOQ) $9.02: we are looking to buy back into CBA into weakness and will consider selling BOQ into a bounce, simply “legging” into quality.
3 - Emeco Holdings (EHL) $2.12: yesterday’s late plunge under $2.20 generated a sell signal but it will probably be gone too far this morning, we will re-evaluate into a bounce.
4 – Domino’s Pizza (DMP) $36.66: we can still see a bounce up above $40 when the they report in a weeks’ time where we may close out our position depending on value elsewhere.
5 – Costa Group (CGC) $3.73: we still like the position but the size is our concern, we are considering lightening / reallocating a portion of the holding into Elders (ELD).
Newcrest Mining (NCM) Chart
Conclusion (s)
We are looking to sell Newcrest (NCM) into strength this morning
We would be buyers of CBA below $80.00
We are considering a move to reduce CGC while adding ELD
BIN is now looking interesting ~$2.15 however the upcoming result is a risk
Global Indices
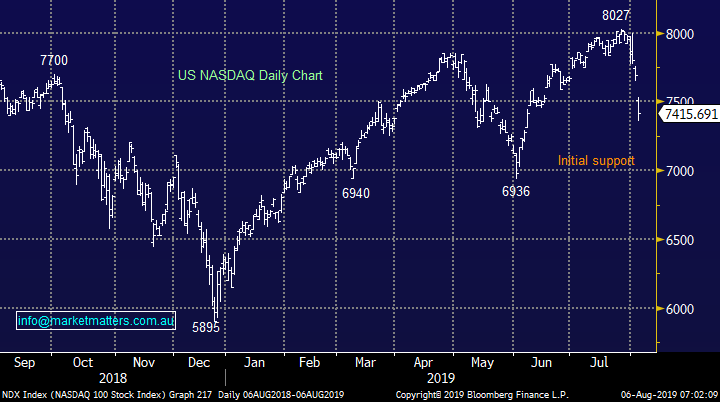
US stocks are now bearish short-term with the S&P500 .
US stocks having reached our target area they have now also generated technical sell signals.
US Nasdaq Index Chart
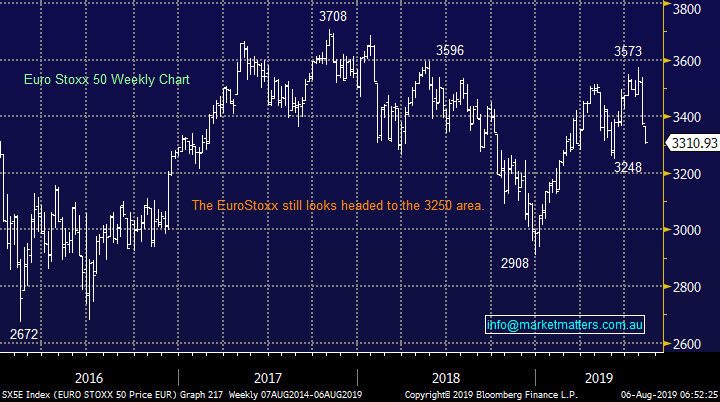
No change again with European indices, we remain very cautious European stocks as their tone has becoming more bearish over the last 2-weeks, we have been targeting a correction of at least 5% for the broad European indices, this looks likely to be achieved this week.
Euro Stoxx 50 Chart
Overnight Market Matters Wrap
· Global markets plumbed overnight as US-China trade tensions increased, following moves by China to suspend purchases of US agricultural products and threatening to introduce tariffs, while allowing their currency to devalue to its lowest level in a decade vs the US$ of 7 yuan. The VIX, which is the measure of equity market volatility, soared 36% to above 23.
· The US equity markets witnessed its biggest fall of the year, with the Dow dropping 960 pts at one stage before recovering slightly to close 760pts lower (-2.9%). The broader S&P 500 dropped 3% while a sell- off in tech stocks drove the Nasdaq 100 off 3.6%, with Apple down over 5% and the semi-conductor index 4.5% weaker. European stocks fared little better with falls of between 1.8% on the German DAX and 2.4% on the UK FTSE.
· Gold stood out once again as a safe haven, with the December futures rallying 1.2% to a new 6 year high of US$1475.7/Oz. Other commodities, however, suffered the same fate as the equity markets, with iron ore dropping another 6.7% to just above US$100/tonne, the price of Brent crude also dropping 3% to US$60/bbl., while copper eased 0.8% lower to US$2.55/lb.
· The September SPI Futures is indicating the ASX 200 to follow the US lead and lose 107 points, testing the 6530 level this morning.
Have a great day!
James & the Market Matters Team
Disclosure
Market Matters may hold stocks mentioned in this report. Subscribers can view a full list of holdings on the website by clicking here. Positions are updated each Friday, or after the session when positions are traded.
Disclaimer
All figures contained from sources believed to be accurate. Market Matters does not make any representation of warranty as to the accuracy of the figures and disclaims any liability resulting from any inaccuracy. Prices as at 06/08/2019
Reports and other documents published on this website and email (‘Reports’) are authored by Market Matters and the reports represent the views of Market Matters. The MarketMatters Report is based on technical analysis of companies, commodities and the market in general. Technical analysis focuses on interpreting charts and other data to determine what the market sentiment about a particular financial product is, or will be. Unlike fundamental analysis, it does not involve a detailed review of the company’s financial position.
The Reports contain general, as opposed to personal, advice. That means they are prepared for multiple distributions without consideration of your investment objectives, financial situation and needs (‘Personal Circumstances’). Accordingly, any advice given is not a recommendation that a particular course of action is suitable for you and the advice is therefore not to be acted on as investment advice. You must assess whether or not any advice is appropriate for your Personal Circumstances before making any investment decisions. You can either make this assessment yourself, or if you require a personal recommendation, you can seek the assistance of a financial advisor. Market Matters or its author(s) accepts no responsibility for any losses or damages resulting from decisions made from or because of information within this publication. Investing and trading in financial products are always risky, so you should do your own research before buying or selling a financial product.
The Reports are published by Market Matters in good faith based on the facts known to it at the time of their preparation and do not purport to contain all relevant information with respect to the financial products to which they relate. Although the Reports are based on information obtained from sources believed to be reliable, Market Matters does not make any representation or warranty that they are accurate, complete or up to date and Market Matters accepts no obligation to correct or update the information or opinions in the Reports. Market Matters may publish content sourced from external content providers.
If you rely on a Report, you do so at your own risk. Past performance is not an indication of future performance. Any projections are estimates only and may not be realised in the future. Except to the extent that liability under any law cannot be excluded, Market Matters disclaims liability for all loss or damage arising as a result of any opinion, advice, recommendation, representation or information expressly or impliedly published in or in relation to this report not withstanding any error or omission including negligence.