The ASX200 surges over 6000, now what? (A2M, CGF, CBA, BHP)
**Firstly, we had some IT issues yesterday sending the afternoon report so it is included at the end of this morning’s note for those interested**
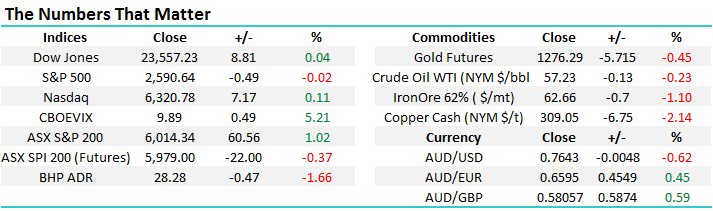
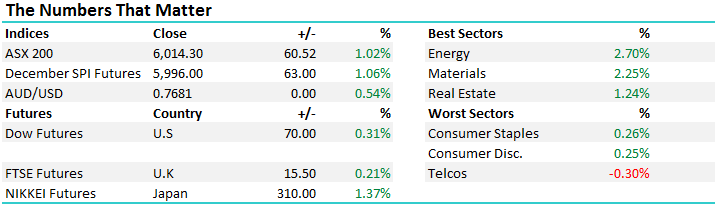
The ASX200 roared over 6000 on Melbourne Cup Day but is looking to open down 25-points this morning, below the major milestone, as resource stocks came under pressure overnight. Today will be a definite test of the markets strength at these new levels with copper in particular weak, down over 2% in the US, and BHP is set to open down over 50c.
The question is: “Have fund managers and “shorts” finally capitulated to the markets strength on Cup day creating a short-term top?”
Today were going to stand back and take a deep breath amongst all the euphoria with the local indices performance since October and consider what next.
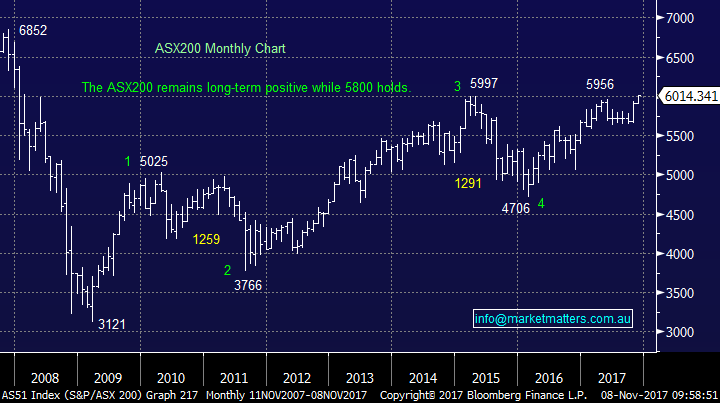
ASX200 Monthly Chart
Today is the 8th of November, beware!
Yesterday’s strength in our stocks really felt like some forced buying of the overall market was present along with the obvious impressive gains within the resources space e.g. BHP +3.9% and Fortescue (FMG) +4.8% - however it must be noted that lows volumes typically exacerbate the falls
However, we are very conscious of the seasonal factors at play as we move into the typically volatile and weak November.
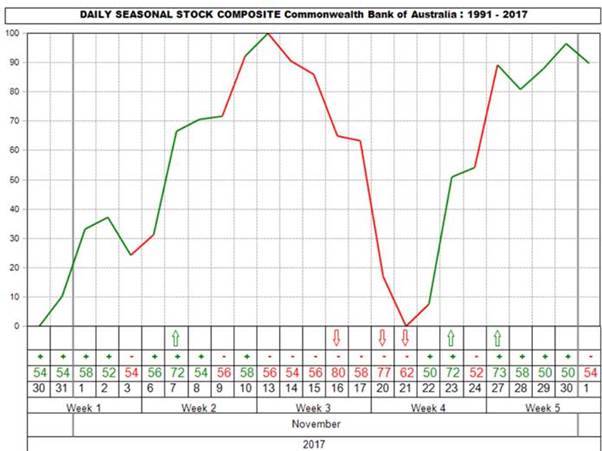
Firstly, the statistics are amazingly consistent for CBA in November, with very little deviation, especially since the GFC when the market including CBA has been rallying.
1. CBA’s average pullback at one stage in November over the last 8-years is -6.1%.
2. The smallest correction was -3.2% but in 2009 and 2011 the pullback was over -10%.
3. On average if you sell around the 12-14th and buy back around the 22nd you’ve added solid value to your portfolio.
This clearly throws up the opportunity for switching between our banks this month, especially with succulent dividends on offer. So far, this November the numbers for CBA are boring as we approach the “classic” sell window:
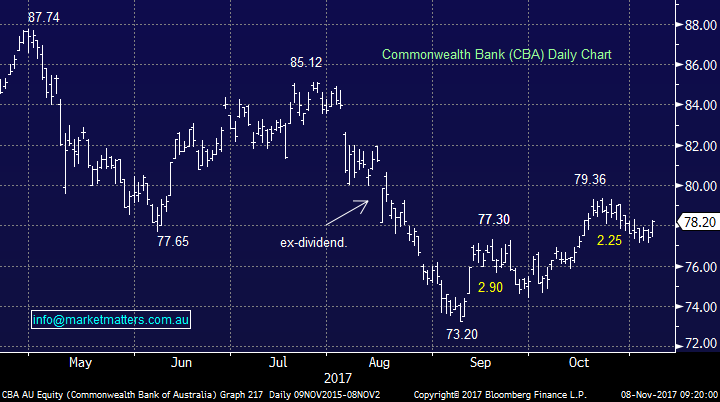
· CBA is up 0.7% to-date this November.
· CBA is $1.16 below its October’s high of $79.36.
Hence at this stage we see 2 obvious conclusions:
1. There is no risk / reward reason to buy CBA at his point in time.
2. If CBA rallies towards $79.50-$80 over the coming days there are plenty of reasons to be a seller.
Commonwealth Bank (CBA) Daily Seasonality Chart
Commonwealth Bank (CBA) Daily Chart
Secondly, the statistics are also very persuasive when we look at the ASX200 around this time of year:
1. Since the GFC at some stage in November the ASX200 has experienced an average -5.3% pullback with the smallest retracement being -2.8%.
2. The correction usually lasts ~11 days and typically commences around the 10th, i.e. Friday.
The ASX200’s rally over 6000 is very impressive on a broad participation level which can be illustrated when we consider where some of the markets heavyweights were trading back in mid-2015 when we previously tested 6000:
· CBA was over $96 and is at $78 with other “big 4” banks similarly lower today.
· Woolworths (WOW) was around $30 and is at $26.11 today.
· BHP was over $30 even after yesterday’s strong rally it’s still under $29 today.
· Telstra (TLS) was well over $6 but as we all know it’s ~$3.50 today.
Back in mid-2015 the market valuation was very stretched on 17.5x forward earnings compared to 16.5x today. While this is certainly expensive compared to the historical average of 14.4x it does allow further “wriggle room” to generate a huge sell signal.
Hence overall, we remain bullish but considering the seasonal statistics for this time of year believe it’s prudent not to chase the current strength.
A Portfolio buy & sell we are considering.
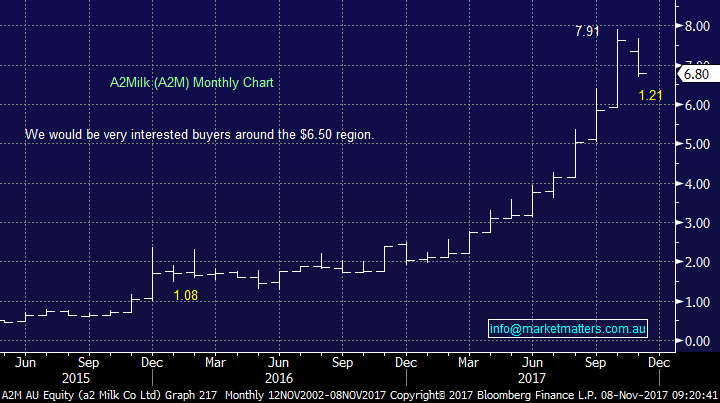
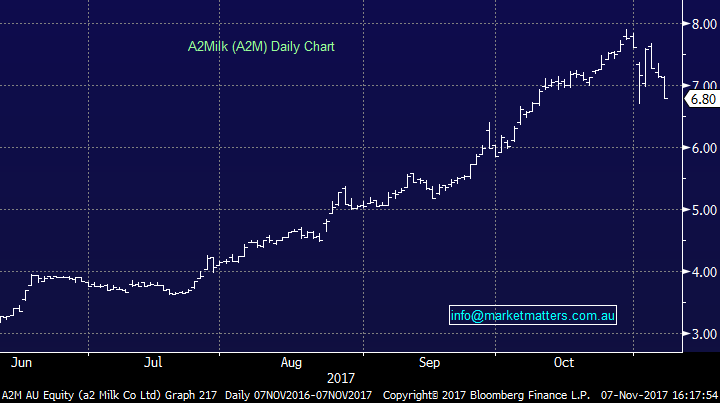
1 Buy A2 Milk (A2M) $6.80
We have discussed A2M over recent weeks as the “hot stock” of 2017 has come under pressure since Colonial First State Asset Management trimmed back its holding in the dairy company from a 6.4% stake to a 5.4% stake. Yesterday when the market rallied over 1% A2M fell almost 5% as investors lock in some profits.
MM may look to accumulate A2M between $6 and $6.50.
A2 Milk (A2M) Monthly Chart
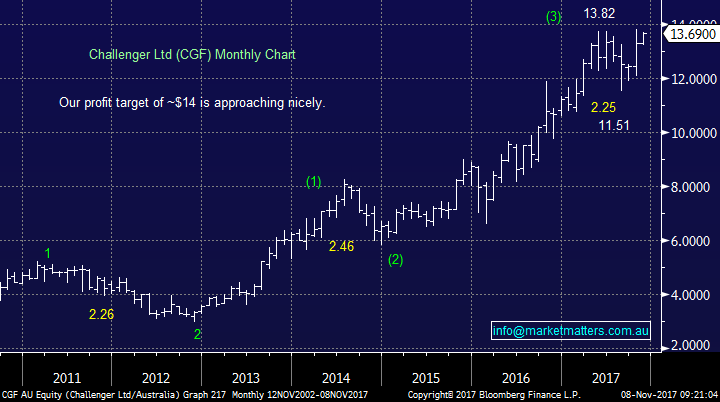
2 Sell Challenger (CGF) $13.69
MM are showing almost a 15% paper profit on our CGF position initiated in September, our target of ~$14 is now just over 2% away.
MM will potentially sell our CGF position if / when it trades around $14.
Challenger Ltd (CGF) Monthly Chart
Global Indices
US Stocks
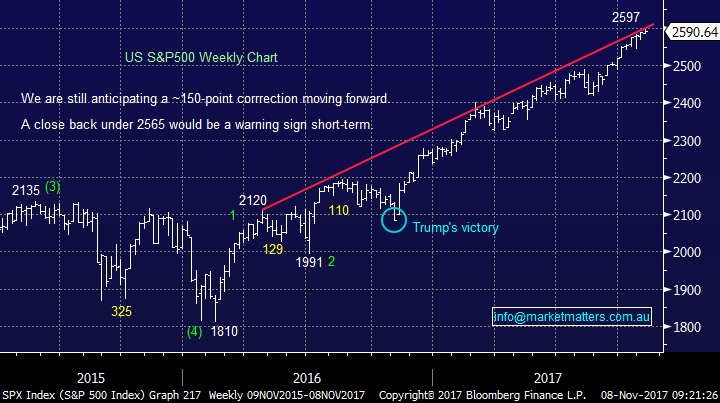
US equities slipped marginally overnight after making all-time highs earlier in the day.
Overall there is no change to our short-term outlook for US stocks, where we would advocate patience ideally targeting a ~5% correction for the broad market to provide a decent risk / reward buying opportunity.
US S&P500 Weekly Chart
European Stocks
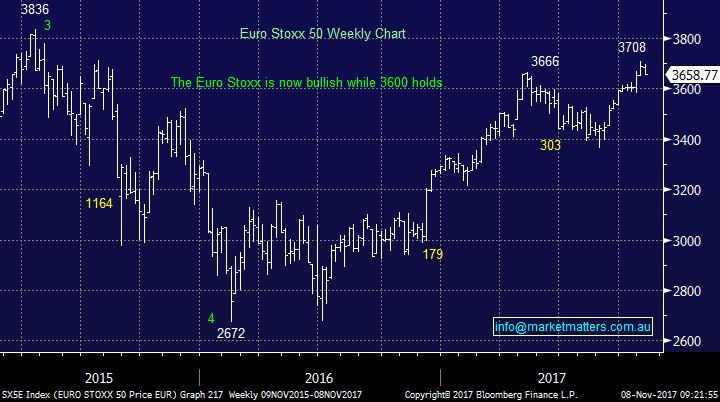
European indices fell over 0.5% last night but while they remain bullish technically at current levels we would not advocate buying from a risk / reward perspective.
Euro Stoxx 50 Weekly Chart
Conclusion (s)
We still believe the market has further to travel on the upside but from a risk / reward basis we would not be chasing right now on an index level, of course individual stocks may provide excellent opportunities.
Overnight Market Matters Wrap
· The US share markets had a breather overnight, ending its session mixed as profit taking was witnessed after the US House of Representatives were to work out further details of the much discussed tax cuts.
· European markets also retreated from their post GFC highs with the key UK, French and German markets down between 0.5% and 0.7%.
· In a weaker night all round, commodities also dipped, with the oil price, which has rallied strongly since mid-year to near two and half year highs on a tighter supply outlook, easing back from Mondays highs while industrial metals and gold were also weaker.
· Consequently the ASX 200 index, which yesterday charged thru the 6000 level for the first time since 2008, is expected to struggle to hold that level with the futures indicating the ASX 200 to remain testing the 6,000 area this morning.
Afternoon Report – 7th November – Market cracks through 6000 – RBA holds rates at 1.5% - Rekindling wins the cup
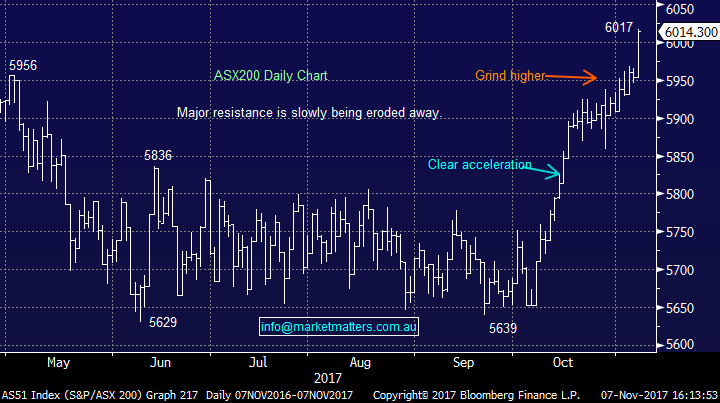
A bullish session for Aussie stocks led by continued buying in the resource sector following some decent leads in commodity markets overseas which prompted a strong move over 6000 today for the ASX 200 – the highest level since Feb 2008. On days like today, with low volumes courtesy of the race that stops the nation – markets move more aggressively in the direction of least resistance and clearly that is to the upside at present.
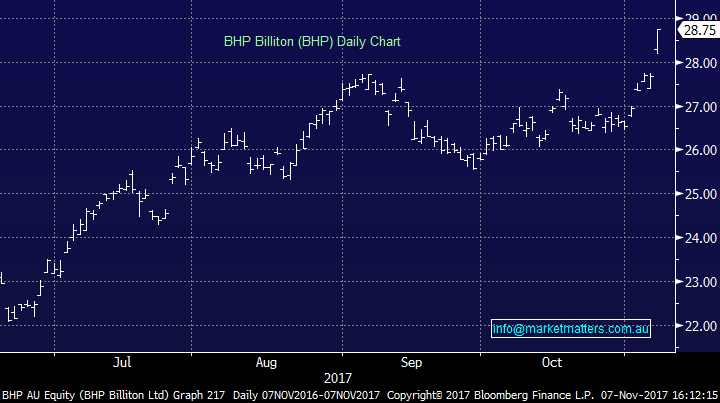
The strength in the resource space is clear for all to see, but given the lack of clear bullish sentiment in the financials – the biggest index weight which was up just 0.57% on the session highlights how aggressively resources and energy stocks have been bid up today. BHP benefitted from strength in both Oil and Iron Ore and put on an impressive 3.90% to close at $28.75 outperforming it’s overseas leads, while the like of Santos (STO) +3.49%, Woodside (WPL) +3.35% and Fortescue (FMG) +4.79% the clear standouts. As we wrote in the AM report today, our 12.5% weighting towards the resources sector in the MM Growth Portfolio feels low however we do have exposure to Independence Group (IGO) which put on +4.43% today to close at $4.48.
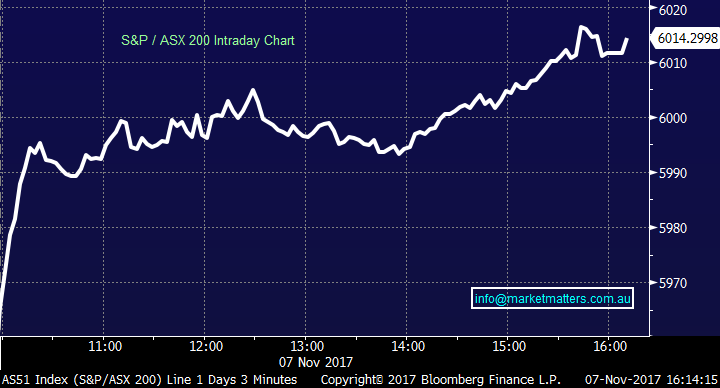
Overall today we had a range of +/- 53 points, a high of 6017, a low of 5964 and a close of 6014, up +60pts or +1.02%.
ASX 200 Intra-Day Chart
ASX 200 Daily Chart
BHP (BHP) – Bang! – the personification of bullishness in the resources sector today with BHP alone adding +11 index points to the ASX 200. You know the feeling you have when you think you’ve gotten off the bus at the right stop in order to get a better seat on the next bus…all looks good as you’re sitting with a coffee in the hand waiting for the express as the bus you’ve just alighted from gets swallowed in traffic…but suddenly the traffic disperses, the congestion eases and the bus goes full steam ahead. Suddenly the coffee doesn’t taste as good, and you suddenly become tempted to jump on anything that goes by. We’ll sit patiently at the bus stop for now, however are feeling a little uncomfortable about it!
BHP (BHP) Daily Chart
A2 Milk (A2M) – interesting to see another solid day of selling today and the trend is starting to crack. We’ve called a buy into weakness sub $6.50 as a trade and this level is fast approaching. No news today and the stock was down nearly 5% o0n decent volume…
A2 Milk (A2M) Daily Chart
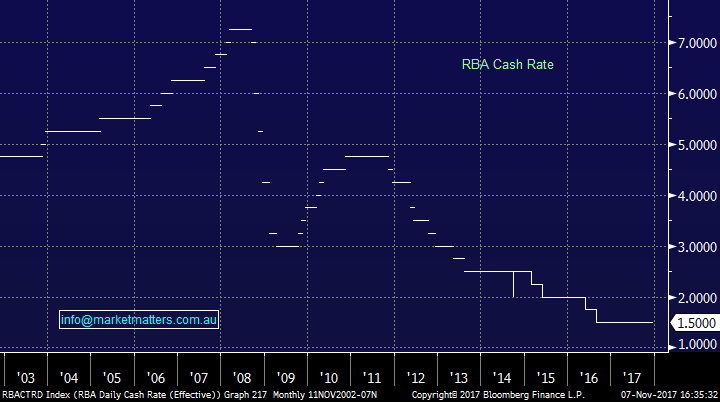
The RBA kept rates unchanged today at 1.5%, saying risks around the housing market had eased + they were reasonably upbeat the Aussie economy. The 14th straight meeting where they left things unchanged however Reserve Bank governor Philip Lowe did say that the outlook for economic growth and non-mining business investment has improved, with forward-looking "indicators being more positive than they have been for some time.” Clearly it’s a balancing act for the RBA and right now it seems inactivity is the safest approach
RBA Cash Rate
And finally, I had no luck on the cup today nor did many of the MM team, however my beautiful bride backed Rekindling for the win. Not enough on it for us to the sail off into the sunset so the AM report will be back tomorrow!
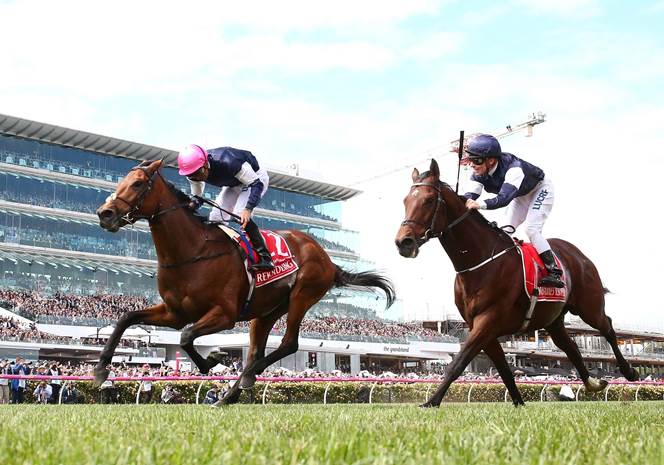
Source; Internet

Disclosure
Market Matters may hold stocks mentioned in this report. Subscribers can view a full list of holdings on the website by clicking here. Positions are updated each Friday, or after the session when positions are traded.
Disclaimer
All figures contained from sources believed to be accurate. Market Matters does not make any representation of warranty as to the accuracy of the figures and disclaims any liability resulting from any inaccuracy. Prices as at 08/11/2017. 8.00AM.
Reports and other documents published on this website and email (‘Reports’) are authored by Market Matters and the reports represent the views of Market Matters. The MarketMatters Report is based on technical analysis of companies, commodities and the market in general. Technical analysis focuses on interpreting charts and other data to determine what the market sentiment about a particular financial product is, or will be. Unlike fundamental analysis, it does not involve a detailed review of the company’s financial position.
The Reports contain general, as opposed to personal, advice. That means they are prepared for multiple distributions without consideration of your investment objectives, financial situation and needs (‘Personal Circumstances’). Accordingly, any advice given is not a recommendation that a particular course of action is suitable for you and the advice is therefore not to be acted on as investment advice. You must assess whether or not any advice is appropriate for your Personal Circumstances before making any investment decisions. You can either make this assessment yourself, or if you require a personal recommendation, you can seek the assistance of a financial advisor. Market Matters or its author(s) accepts no responsibility for any losses or damages resulting from decisions made from or because of information within this publication. Investing and trading in financial products are always risky, so you should do your own research before buying or selling a financial product.
The Reports are published by Market Matters in good faith based on the facts known to it at the time of their preparation and do not purport to contain all relevant information with respect to the financial products to which they relate. Although the Reports are based on information obtained from sources believed to be reliable, Market Matters does not make any representation or warranty that they are accurate, complete or up to date and Market Matters accepts no obligation to correct or update the information or opinions in the Reports.
If you rely on a Report, you do so at your own risk. Any projections are estimates only and may not be realised in the future. Except to the extent that liability under any law cannot be excluded, Market Matters disclaims liability for all loss or damage arising as a result of any opinion, advice, recommendation, representation or information expressly or impliedly published in or in relation to this report notwithstanding any error or omission including negligence.
To unsubscribe. Click Here


