Telstra, the next phoenix or dodo? (APPL, QAN, BHP, CGF, TLS)
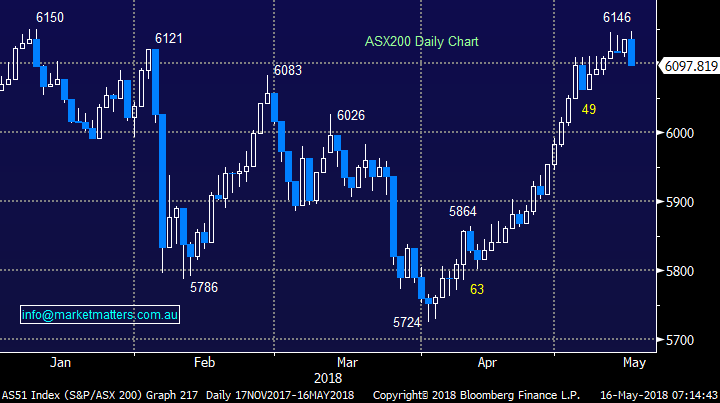
Yesterday the ASX200 had a tough day at the office falling 37-points / 0.6% with ex-dividend National Australia Bank (NAB) and Telstra (TLS) accounting for almost half of the decline. It was a rare sight to see the banking sector close in the black, let alone on a weak day, it feels like they can now stabilise assuming of course we have no further damaging news from the Hayne royal commission while property prices also require close monitoring. Short-term we can easily see an extension to the current pullback by our market to ~6050, or another 0.8% lower – no big deal this stage.
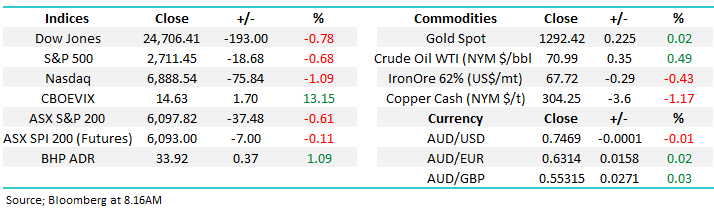
Overnight US stocks had their largest fall in 2-weeks as positive retail sales data sent bond yields soaring to their highest level since 2011, helping the $US dollar make fresh 2018 highs. Good macro-economic news is not always welcomed by stocks, especially when it prompts higher inflation and higher interest rates. The local market is set to open only marginally lower this morning, potentially already anticipating last night’s weakness in our trade yesterday – the ASX200 is often a leading indicator.
- Medium-term MM remains mildly bullish targeting 6250 but the risk / reward is no longer compelling for the buyers in aggregate – we are wearing our “sellers hat”.
Today’s report is going to reflect on some recovery stories that have literally risen from the ashes like a phoenix while we also question whether TLS can join this impressive list or is it going the way of the Blackberry, Kodak and Nokia?
ASX200 Chart
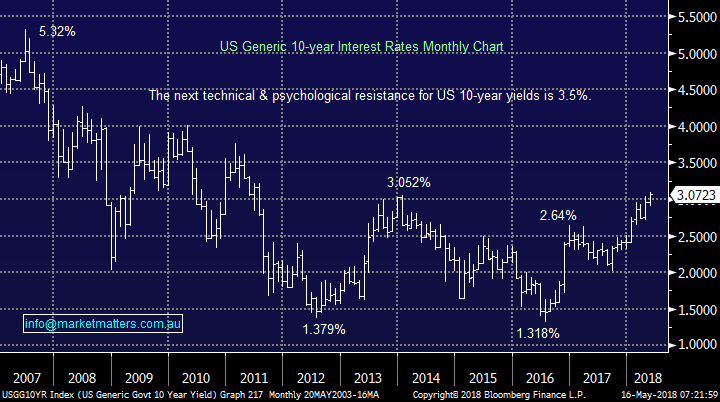
Overnight the important US 10-year bond the yield surged above 3% to its highest level since 2011, I can see MM writing similar annotations to this throughout 2018/9 i.e. the multi decade bear market for interest rates is over. The big question we should all be considering is will it herald the end of asset appreciation e.g. houses and stocks?
One question we frequently get asked is around what stocks will fall if / when rates rise and the market subsequently experiences a meaningful correction, last night’s moves in the S&P500 gave some strong clues. The S&P500 fell -0.68% but notably is up 5.9% for the last 6-monmths.
- Overnight the greatest weakness was experienced in the Health Care (-1.3%) and Real Estate (-1.7%) sectors.
- Over the last 6-months Real Estate (-7.6%), Consumer Staples (-9.6%) and utilities (-11.8%) are down while Consumer Discretionary is up +13.3%.
Three takeout’s to us are:
- Money has been moving from Consumer Staples (essential spending items) to discretionary spending – the US public feels financially comfortable and have started spending / enjoying themselves e.g. last night’s Retail Sales number.
- However the “yield play” is getting smashed, i.e. sectors / companies that suffer when interest rates rise.
- We also believe there will be an “uncle point” where high valuation stocks like healthcare and tech. will struggle – the usual historical road map when rates rise.
US 10-year bond yields Chart
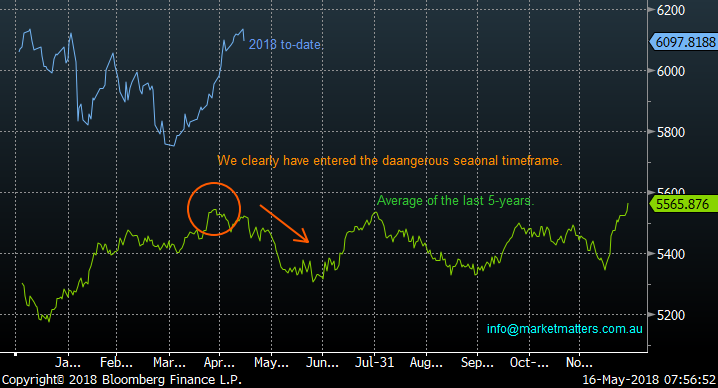
We regularly preach remaining open-mindedness and while we have an eventual target for the ASX200 up around 6250 we must remain very conscious that we are in the middle of May, the seasonally dangerous period for stocks:
- As the below 5-year chart illustrates this is commonly a dangerous period for stocks.
- Over the last 10-years the average decline for May & June combined is only -3%, before July arrives as the strongest month of the year, with an average gain of +3.7%.
- However, since the GFC the average pullback from the May high to the next swing low is over 10% i.e. “Sell in May & go away”.
Hence when you look at the last 2-points it’s easy to see the market often rallies at the start of May before having a decent correction into June / early July – we must remain aware that we are in May.
ASX200 Seasonality Chart
Telstra, Phoenix or dodo?
Before we look at Telstra lets quickly consider 4 household names that have made phenomenal comebacks when many thought they were in the “non-investable basket” or worse potential going to fade into oblivion.
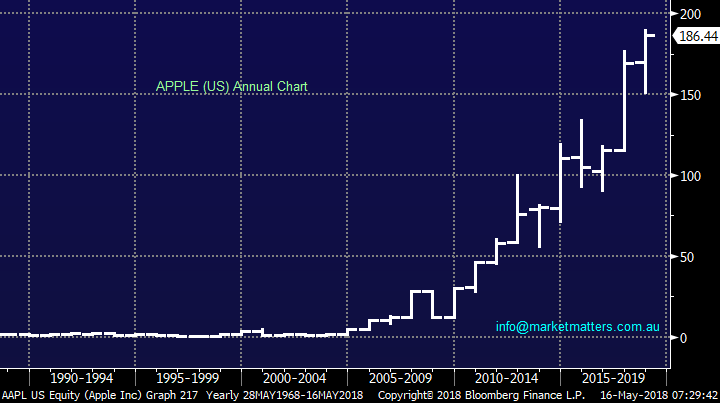
1 APPLE Inc (US) $186.44
Perhaps the biggest of all is APPLE which faced tough times due to poor sales and low market share during the 1990s of its personal computers. Steve Jobs, who had been ousted from the company in 1985, returned to Apple in 1996 after his company NeXT was bought by APPLE and most of us know the rest, give or take a few details.
- A few more wrong turns in the road and we may not have seen the iPhone as we know it today!
APPLE Inc (US) Chart
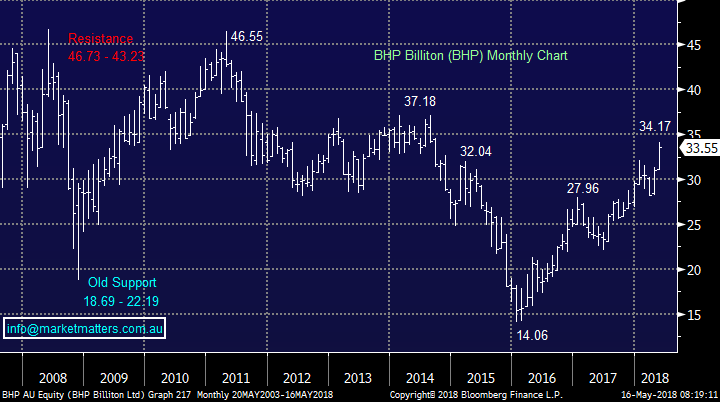
2 BHP Billiton (BHP) $35.55
BHP may be in favour now yet it remains more than 20% below its 2011 high while the ASX200 has advanced ~60%. I still remember when MM started “nibbling” at / buying BHP around $20, unsuccessfully the first time, we got many queries from subscribers who thought we were simply mad! Today everyone loves BHP and feels it can do no wrong.
However, BHP is a diversified resources business and hence very cyclical in nature – to us it’s simply a big “trading” stock, or more accurately one that we like in our portfolio every few years but not always.
BHP Billiton (BHP) Chart
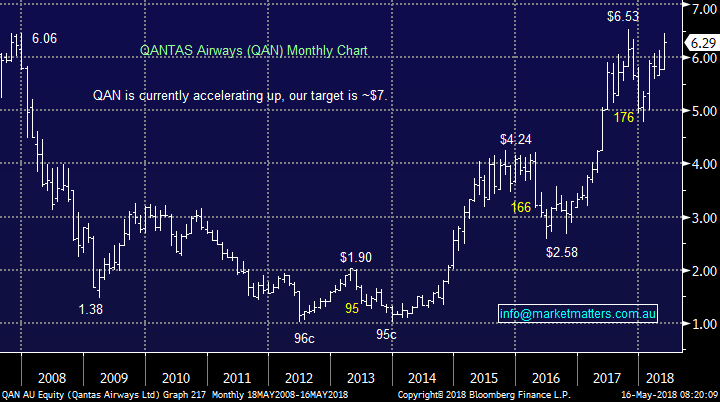
3 QANTAS (QAN) $6.29
Only 5/6 years ago investors simply hated QAN and questioned whether it could survive without government support. Yesterday I dropped by the Future Generation event with Qantas being discussed by fundies as a No 1 pick!
Alan Joyce has done a phenomenal job with the business and the significant correction in energy costs has obviously been a very supporting factor.
QANTAS (QAN) Chart
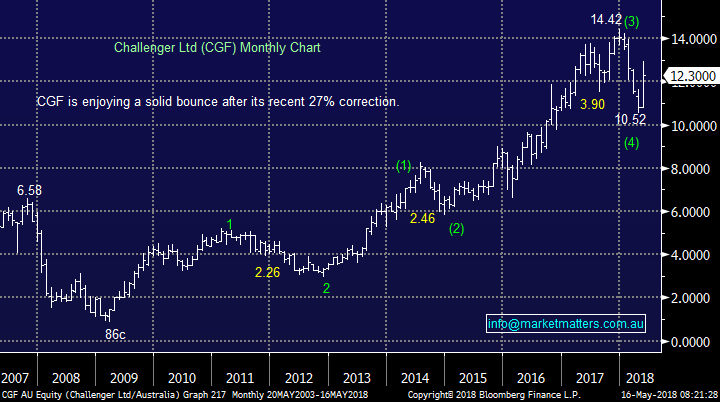
4 Challenger (CGF) $12.30
After the GFC Challenger (CGF) looked / felt awful as investors questioned whether it could survive paying out guaranteed annuities while the value of its investments crashed.
Today CGF has thrived as global share markets have recovered from those dark days! An 86c low in CGF!
Challenger (CGF) Chart
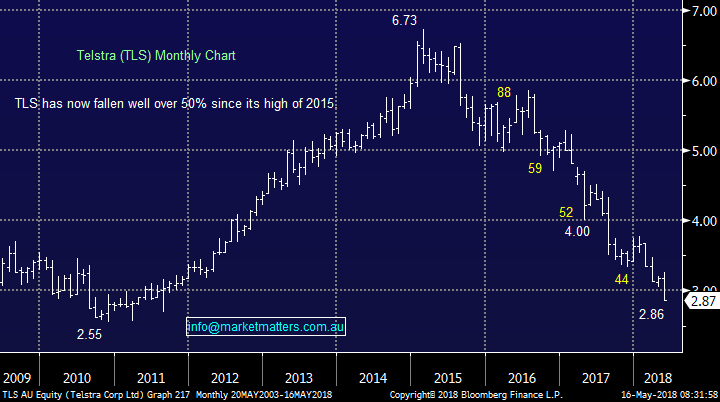
Telstra (TLS) $2.87
Now considering Telstra which is clearly having a nightmare run, falling almost 11% over the last 5-days and making a fresh 7-year low yesterday. You will have to search extremely hard to find anybody that likes this stock, something that certainly pricks our ears up.
- We sold part of MM’s holding in TLS in January, now well over 20% higher, clearly we wish we had sold all of it!
- Our plan was to increase our holding ~$3.10, fortunately we have not pressed this buy button yet – it simply did not “feel right”.
This week’s fall has occurred following a market update where TLS which stated they would likely hit the “low end” of their earnings guidance. Most definitely not a major downgrade as we often see but the market already has the knives out for TLS and specifically for the struggling mobile business, in “challenging conditions”.
However, it wasn’t all bad news, free cash flow is expected at the top end of its guidance range of $4.2-4.7 billion as they aggressively cut costs plus management are now under intense pressure to deliver.
- TLS reaffirmed its full-year dividend will be 22 cents per share fully franked.
Analysts have largely declared the dividend is not sustainable earmarking 20c pa moving forward but this would still put TLS on a 7% fully franked yield.
- We like TLS as a speculative buy around $2.85.
We think TLS remains a dominant player in a growth market if we look far enough ahead into the future – come on Andy Penn, shows us some vision and prove the masses wrong!
NB. We also like that Telco’s usually perform well during stock market downturns which we believe is on the horizon.
Telstra (TLS) Chart
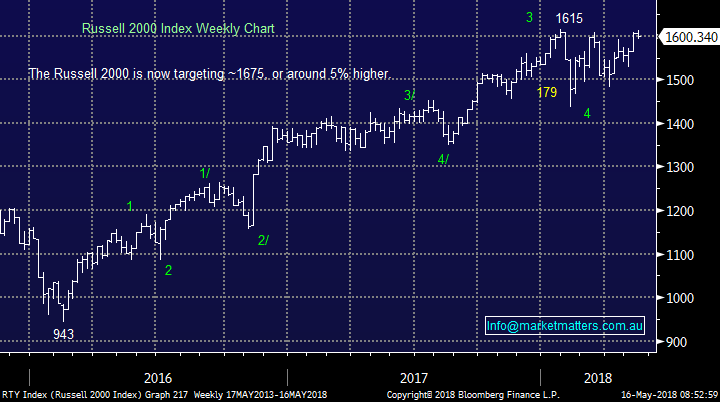
Overseas Indices
We remain bullish overseas indices targeting fresh 2018 highs for many indices but we are mindful that we in May!
US Russell 2000 Chart
Conclusion
1 MM likes Telstra (TLS) around the $2.85 region.
2 We also will be watching A2 Milk (A2M) and CYBG (CYB) both of whom traded / are trading lower overseas, they may present opportunities to increase our holdings.
Watch for alerts this morning – we are likely to increase our weighting in A2 Milk (A2M) the morning should it trade around $10.50
Overnight Market Matters Wrap
· The US markets closed lower overnight as US Treasury yield had hit its highest level since 2011, surpassing the 3% level as strong retail and economic data fuelled further confirmation of imminent Fed rate rises.
· On the commodities front, Crude Oil rose while Iron Ore eased – BHP is expected to outperform the broader market on the back of the strength in oil, after ending its US session up an equivalent of 1.09% from Australia’s previous close.
· The June SPI Futures is indicating the ASX 200 to open with little change this morning.
Have a great day!
James & the Market Matters Team
Disclosure
Market Matters may hold stocks mentioned in this report. Subscribers can view a full list of holdings on the website by clicking here. Positions are updated each Friday, or after the session when positions are traded.
Disclaimer
All figures contained from sources believed to be accurate. Market Matters does not make any representation of warranty as to the accuracy of the figures and disclaims any liability resulting from any inaccuracy. Prices as at 16/05/2018. 8.31AM
Reports and other documents published on this website and email (‘Reports’) are authored by Market Matters and the reports represent the views of Market Matters. The MarketMatters Report is based on technical analysis of companies, commodities and the market in general. Technical analysis focuses on interpreting charts and other data to determine what the market sentiment about a particular financial product is, or will be. Unlike fundamental analysis, it does not involve a detailed review of the company’s financial position.
The Reports contain general, as opposed to personal, advice. That means they are prepared for multiple distributions without consideration of your investment objectives, financial situation and needs (‘Personal Circumstances’). Accordingly, any advice given is not a recommendation that a particular course of action is suitable for you and the advice is therefore not to be acted on as investment advice. You must assess whether or not any advice is appropriate for your Personal Circumstances before making any investment decisions. You can either make this assessment yourself, or if you require a personal recommendation, you can seek the assistance of a financial advisor. Market Matters or its author(s) accepts no responsibility for any losses or damages resulting from decisions made from or because of information within this publication. Investing and trading in financial products are always risky, so you should do your own research before buying or selling a financial product.
The Reports are published by Market Matters in good faith based on the facts known to it at the time of their preparation and do not purport to contain all relevant information with respect to the financial products to which they relate. Although the Reports are based on information obtained from sources believed to be reliable, Market Matters does not make any representation or warranty that they are accurate, complete or up to date and Market Matters accepts no obligation to correct or update the information or opinions in the Reports.
If you rely on a Report, you do so at your own risk. Any projections are estimates only and may not be realised in the future. Except to the extent that liability under any law cannot be excluded, Market Matters disclaims liability for all loss or damage arising as a result of any opinion, advice, recommendation, representation or information expressly or impliedly published in or in relation to this report notwithstanding any error or omission including negligence.
To unsubscribe. Click Here


