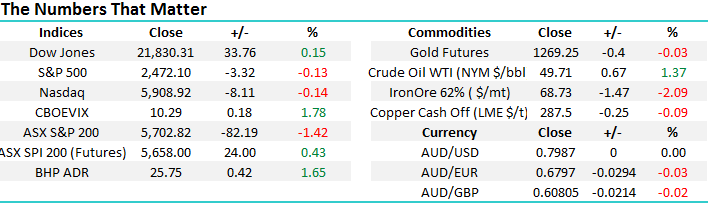
Subscribers questions
As we have been discussing over the last 10-days MM has turned bearish the ASX200, at least over the next few months. We continue to target a pullback towards the 5500-major support area, around 3.5% lower, which should provide some excellent risk / reward buying opportunities. Statistically after trading between 5629 and 5836 for 10-weeks some volatility is likely to be very close at hand. Also remember from the Weekend Report we often get a decent pullback in the first 1-2 weeks of August, hence be prepared.
MM has now increased its cash position to 23.5% level and is looking to buy into weakness until further notice.
ASX200 Weekly Chart
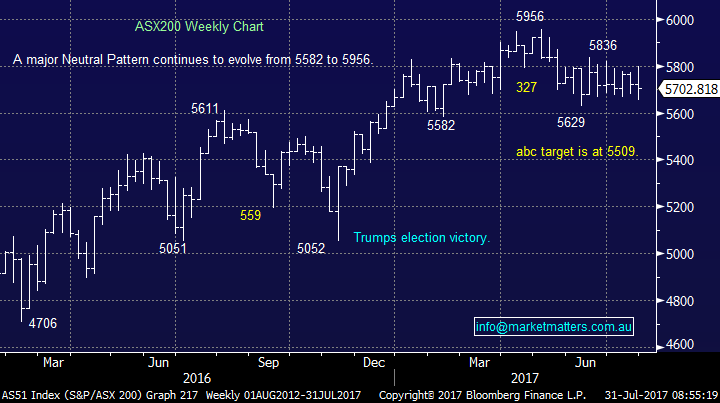
Subscribers should also remember we believe the major bull market that commenced back in March 2009 is maturing fast, hence volatility which has been at historically low levels within equity markets should slowly start to increase. The ASX200 has certainly been choppy and erratic of late whereas the US has continued to simply grind higher.
For MM, the tech NASDAQ Index has followed a perfect technical path since mid-2016 and until it deviates we will continue to use this as our medium-term guide for US stocks.
We now expect a decent 7-8% correction from the leading US tech Index. Importantly we believe the risk / reward has now swung totally from the buy side to sell side.
NASDAQ Weekly Chart
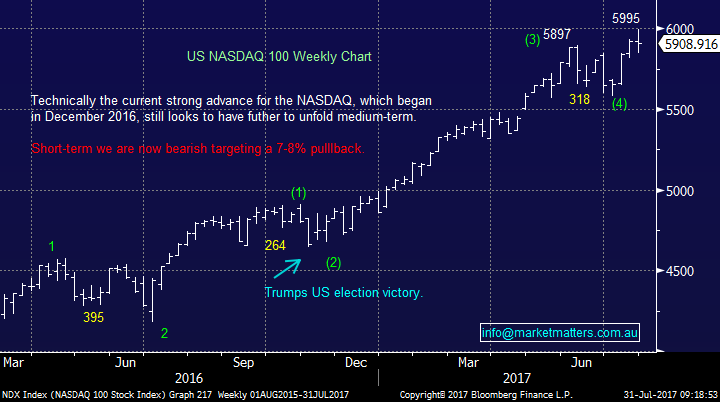
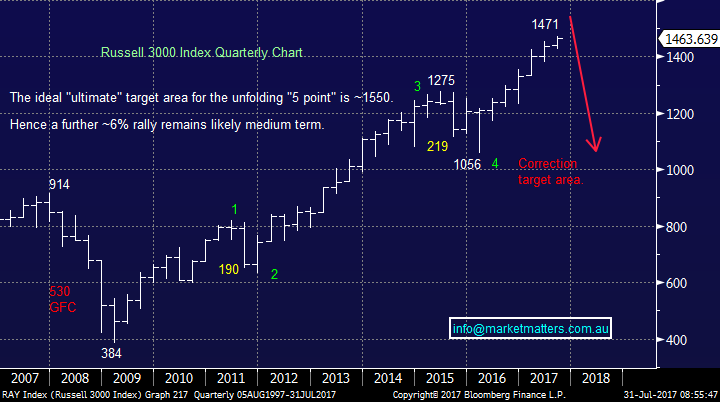
In terms of our bigger picture view for U.S stocks, we don’t see the likely short term weakness as the ‘major top’ but rather a shorter term buying opportunity before the U.S makes a more aggressive ‘blow off’ style peak – most likely another ~6% higher from current levels. Major tops are rarely formed when mkts are simply ‘grinding higher’ as they are now. Importantly moving forward we still see a +20% correction at some point, back towards the lows of 2016 - our best guess at this stage is a major top in early 2018.
Russell 3000 Quarterly Chart
Question 1
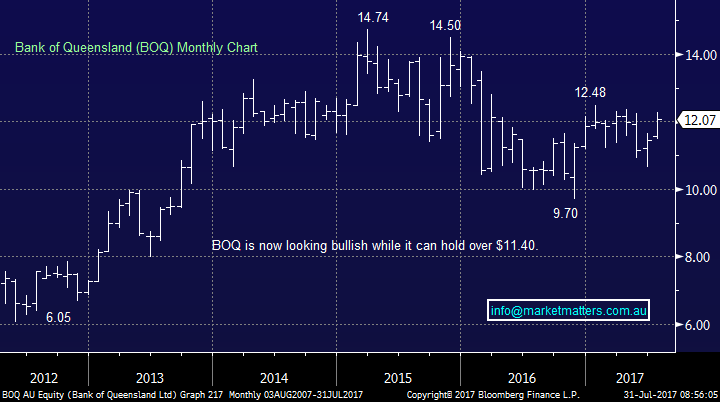
“Re advice in the 30th of July report - what would you by BOQ at and to target what price?” – Mike D.
Morning Mike, thanks for the question following straight on from the Weekend Report, it’s wonderful to experience some clear engagement. With BOQ we would usually say buy close to $12 targeting another test of the $14 area, with concerns only if the stock cannot hold $11.40. However, as we have explained earlier we are targeting a ~3.5% correction back towards the psychological 5500-area by the ASX200. Hence in this case we would set a slightly more pedantic entry level ~$11.80, or 2% lower.
Bank of Queensland (BOQ) Monthly Chart
Question 2
“Dear MM, Thanks for everything that you do, it means a lot to us to at-last have someone honest in this bias-ridden industry. Your new income stocks currently do not suit us, however to have a special segment on resources would be excellent, even if only done once a month. A report on say 10 or 15 of your favoured resource stocks and why. For example,we like VRM because they have a foot in both the mining and food industries, plus they are expecting easy production in a fertiliser hungry country in a few months. Also, OZL is a very well run reliable company with good prospects that has recently been out of favour. KIN has been very popular lately as is SFR. Your customers might even send in some info about their resource favourites that you could simply revise and share.” – Regards Phil B.
Morning Phil, that’s a good idea, I will discuss with the team. We probably do cover resources / banks / healthcare / financials / telco’s etc individually at least once a month but probably only touching on ~5 stocks at a time. One thing we have found since starting MM is subscribers like consistency e.g. a resources report will come out on the first Wednesday of each month. The only downside with this structure is it may be quiet for the sector at the time and all the action occurs in the following week……. perhaps we simply need to cover a few extra stocks, we will ponder.
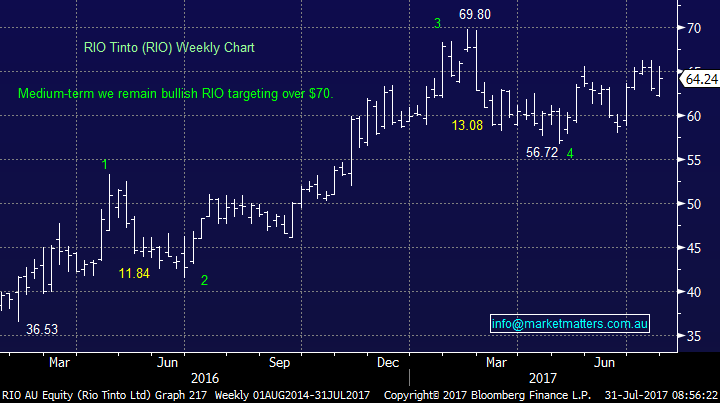
For now, we remain long AWC, BHP and RIO which is almost our largest ever exposure to the resources space. We have a target of ~$70 for RIO who reports early this week which is likely to determine the short-term direction of the stock.
RIO Tinto (RIO) Weekly Chart
Question 3
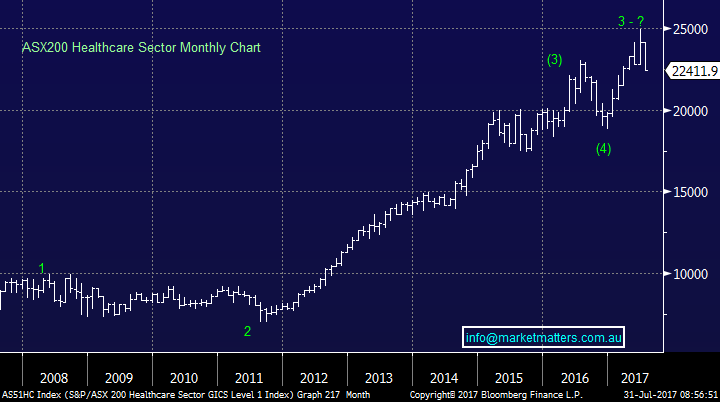
“Morning MM, you have been negative the healthcare sector recently which looks good today with the sector down well over 5% for the month. Are you considering buying any of these stocks if your pullback unfolds in August / September?” – Ta Ian J.
Morning Ian, thanks for the question which as you know currently has us viewing a “hot” market sector from a different view point than the majority of analysts and investors alike. The answer is a simply no, although unlikely would be more accurate as you never know what opportunities individual stocks can throw up during volatile times. The Aussie Dollar is now becoming a headwind for those that are operating overseas, which is the bulk of the sector, and given the market consensus was for a weaker Aussie Dollar, and we now have a stronger one, the outlook statements for the internationally exposed healthcare stocks could be the concern.
Looking at the Healthcare Index, we are targeting a further -10% correction minimum so there is certainly no hurry for us to be aggressively long the sector. As you say the healthcare sector is down well over 5% over the last month compared to the ASX200 only falling a small 0.3%, but we believe this underperformance is in its early days. In short, we have no interest at this stage.
ASX200 Health Index Monthly Chart
Question 4
“Hi MM, can you give a run down on the difference between the growth portfolio and income portfolio (despite the obvious)?” - Thanks Ron S.
Morning Ron, a good question as we continue to expand the overall offering by MM. I would explain this using 2 simple sentences:
1. Growth Portfolio – The PP searches for capital gain plus yield where appropriate with capital preservation obviously important. This is the portfolio we back with our own funds, and the portfolio conveys the more traditional MM approach. Alerts are sent via Email and SMS when we trade, with the portfolio screen on the website updated each Friday.
2. Income Portfolio – The IP searches for yield while focusing strongly on capital preservation with potential capital gain the 3rd component. This is a newer strategy, combines both equities, hybrids and may include ETFs and Bonds at some point in the future (when they look more compelling). This is a model portfolio and alerts are sent via email when we make changes to the portfolio. The specific Weekly Income Report is released around lunchtime each Wednesday with the portfolio updated tat that time. It may be a good idea to go back and review the original ‘Income Report’ by CLICKING HERE
Overnight Market Matters Wrap
· Another mixed session last Friday, with lone ranger in the green, the Dow making a 3-peat in ending its session at record highs. Both the broader S&P 500 and the NASDAQ 100 closed marginally lower.
· Domestically this week, focus will now be shifted on corporate earnings season – with expectations high
· The ASX 200 is looking to open 14 points higher, towards the 5,720 area as indicated by the September SPI Futures this morning.
Disclosure
Market Matters may hold stocks mentioned in this report. Subscribers can view a full list of holdings on the website by clicking here. Positions are updated each Friday.
Disclaimer
All figures contained from sources believed to be accurate. Market Matters does not make any representation of warranty as to the accuracy of the figures and disclaims any liability resulting from any inaccuracy. Prices as at 31/07/2017. 8.00AM.
Reports and other documents published on this website and email (‘Reports’) are authored by Market Matters and the reports represent the views of Market Matters. The MarketMatters Report is based on technical analysis of companies, commodities and the market in general. Technical analysis focuses on interpreting charts and other data to determine what the market sentiment about a particular financial product is, or will be. Unlike fundamental analysis, it does not involve a detailed review of the company’s financial position.
The Reports contain general, as opposed to personal, advice. That means they are prepared for multiple distributions without consideration of your investment objectives, financial situation and needs (‘Personal Circumstances’). Accordingly, any advice given is not a recommendation that a particular course of action is suitable for you and the advice is therefore not to be acted on as investment advice. You must assess whether or not any advice is appropriate for your Personal Circumstances before making any investment decisions. You can either make this assessment yourself, or if you require a personal recommendation, you can seek the assistance of a financial advisor. Market Matters or its author(s) accepts no responsibility for any losses or damages resulting from decisions made from or because of information within this publication. Investing and trading in financial products are always risky, so you should do your own research before buying or selling a financial product.
The Reports are published by Market Matters in good faith based on the facts known to it at the time of their preparation and do not purport to contain all relevant information with respect to the financial products to which they relate. Although the Reports are based on information obtained from sources believed to be reliable, Market Matters does not make any representation or warranty that they are accurate, complete or up to date and Market Matters accepts no obligation to correct or update the information or opinions in the Reports.
If you rely on a Report, you do so at your own risk. Any projections are estimates only and may not be realised in the future. Except to the extent that liability under any law cannot be excluded, Market Matters disclaims liability for all loss or damage arising as a result of any opinion, advice, recommendation, representation or information expressly or impliedly published in or in relation to this report notwithstanding any error or omission including negligence.
To unsubscribe. Click Here


