Subscribers’ Questions
Indices are producing mixed signals at present but we don’t think it’s yet time to be too concerned for share market investors. The ASX200 has already “wobbled” in May correcting 4.3% at one stage as the local major banks came under significant pressure courtesy of 3 banks trading ex-dividend and an unwanted / surprise new govt. tax. Some of the mixed signals we see for the ASX200:
Positive
1. US and most global indices remain very strong, although a pullback would not surprise.
2. The banks and resources have almost reached our targeted retracement area.
Negative
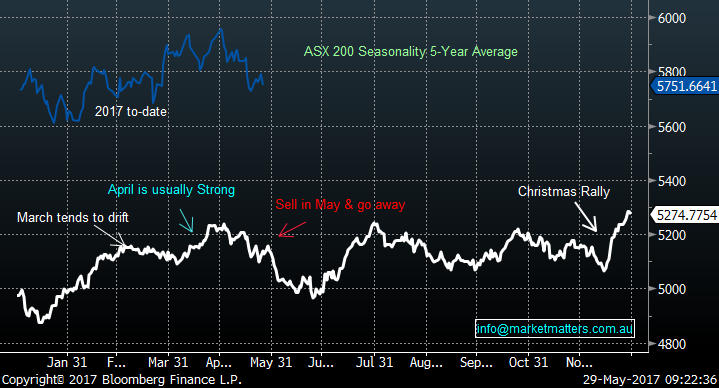
1. Seasonally June is a week month for Australian stocks, plus we’ve already managed to fall in May ignoring all the positive leads from many international markets.
2. Fundamentally there looks to be very little positive economic news on the horizon, there is actually a growing fear that Australia may be close to its first recession since 1991.
MM remains both comfortable and flexible holding 23.5% in cash with potential buying opportunities looming in CBA and FMG – see Weekend Report.
ASX200 Daily Seasonality Chart
With US stocks we continue to focus on 3 main points:
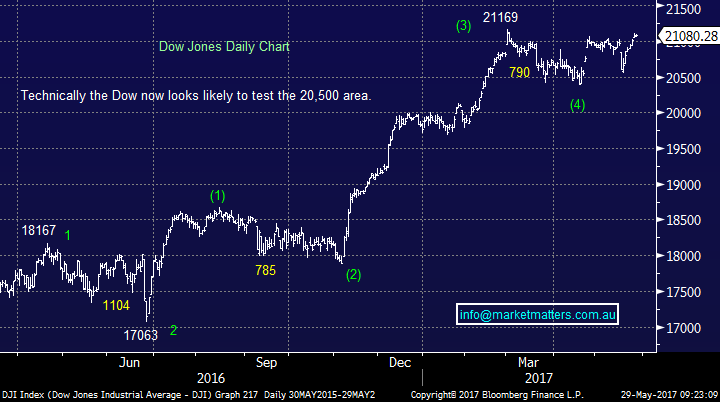
1. We believe US stocks are in the their classic final “Phase 5” of an impressive bull market rally which commenced back in March 2009.
2. Our ideal final target for this move is ~6-8% higher but we must all remain open-minded as our view remains the advance is reaching maturity, often a tricky time.
3. Ultimately we believe the market will correct back to its early 2016 lows, a correction of over 25%.
Short-term the Dow looks set to rally at least another 2% prior to any potential correction.
Dow Jones Daily Chart
Question 1
“Hi Guys, You often talk about a further 6-8% to run in the market cycle, however is this from the 5956 May 1st level, or from current levels.
If it is from here surely this means that the market has now 10-12% to run, plus yield of 5% for a 17% return. If it takes 2 years to reach this level that still 8.5% per annum which is nearly 600% return (6x) that of cash and 3x term deposits. Either way the risk return in equites there is attractive. Would you not agree?” - Shayne
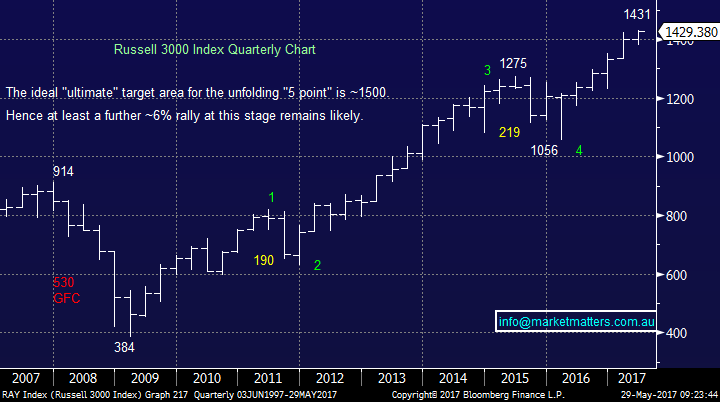
Morning Shayne, a great question as it’s important to MM that subscribers fully understand all of our thoughts around markets. Today I have used the broad Russell 3000 to illustrate our view because we find it one of the clearest indices at present. Hopefully the below 3-points comprehensively answer your question:
1. We are targeting the 1500-1550 area for this index, or ~7% higher from Fridays close.
2. We are conscious that the ASX200 is underperforming US stocks for the 11th consecutive year but believe it’s unlikely that we will experience a major downturn out of sync with the US.
3. Hence like yourself we see value holding stocks at this point in time, especially when compared to term deposits. However we don’t want to be left holding the parcel when the music eventually stops!
Russell 3000 Index Quarterly Chart
Question 2
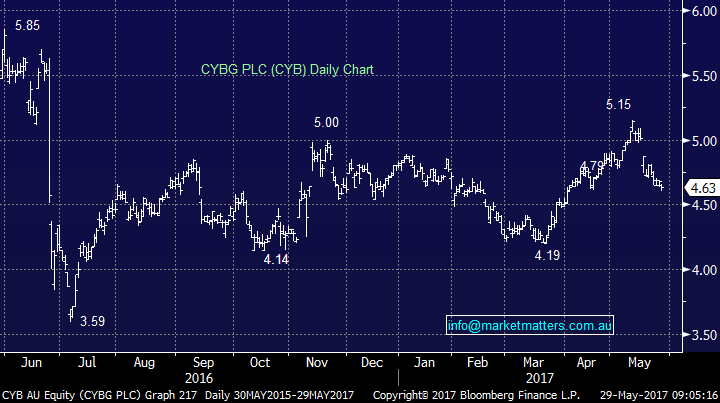
“Hi, It would be great to get your latest thoughts on CYBG PLC, within a morning update.” Regards, Richard.
Hi Richard, CYB has been under pressure similar to the whole banking sector, falling ~10% over the last 11-days. CYB’s weakness has been stock specific on two levels:
1. The company had an average report early in the month, which disappointed many who had pushed the stock higher into the numbers, hence a quick snap lower.
2. The British pound has been under pressure recently due to the mild uncertainty around the UK election in a few weeks – CYB’s revenue is in pounds.
Moving forward, we currently remain comfortable with CYB as it’s the cheapest bank on a valuation basis, the banking sector has nearly reached our targeted pullback area and we continue to favour Europe over both the US / Australia.
CYBG PLC (CYB) Daily Chart
Question 3
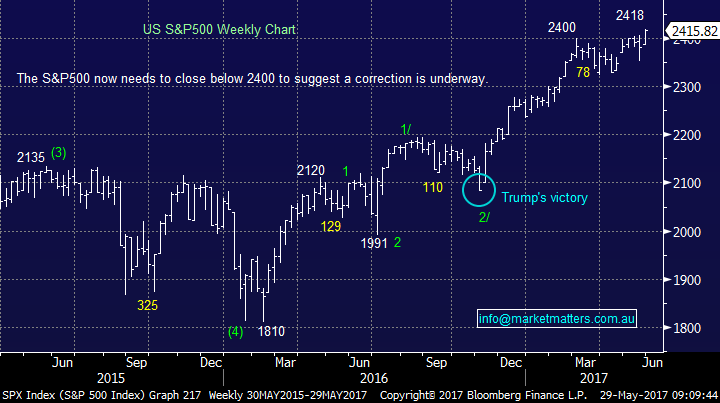
“Hi guys, Do you have any data on capital inflows/outflows to the US? I am looking at signs to determine when this next corrective phase will begin through either support in the dollar and/or US assets. Possible after Trump has finished with the G7 or the "fake news" Washington Post and NY Times.” – Peter.
Morning Peter, you’re certainly looking in an area where we pay definite attention, money flow is what at the very least determines the short-term direction of markets. Our favourite vehicle to gauge how fund managers are investing is the “Bank of America Merrill Lynch survey”.
Google is an excellent tool to keep on top of this information which is regularly released and covers ~175 major fund managers. The takeouts from February’s survey were:
1. Long $US was the most crowded trade, hence its decline has been no surprise.
2. 43% believe we will see further secular stagnation, down from 88% a year ago i.e. investors are becoming more bullish growth.
3. Cash holdings were still above the 10-year average of 4.5% but down from 5.1% to 4.9%, investors are still putting $$ to work in stocks.
A spike down in cash holdings would be a definite warning signal to us for stocks.
US S&P500 Weekly Chart
Question 4
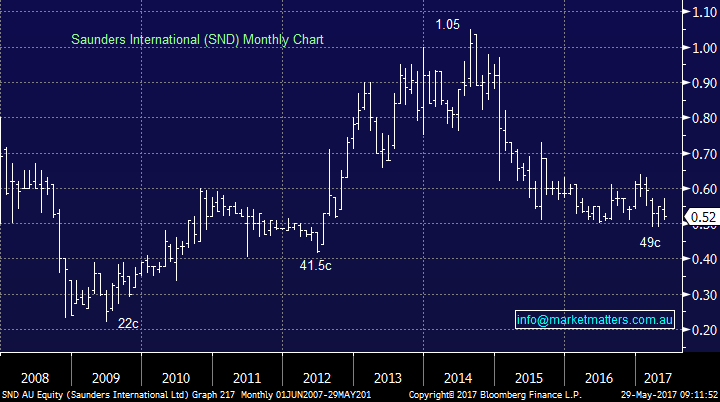
“Hi MM, Interested on your thoughts on the recent listing of TECH and the other the stock is SND - Saunders International Limited.” - Cheers, Nathan
Hi Nathan, thanks for taking us away from our usual terrain, a few quick comments below on areas which we are definitely not experts in!
TECH – The recently launched Morningstar Global Technology ETF, this ETF has a very small market cap. of only 5.5m. While we believe for the next 6-9 months tech. stocks, i.e. the NASDAQ, will be the best performing index, we would rather gain exposure via a basket of stocks within the leading US index, hence avoiding fees and expenses.
SND – A Sydney company that designs, constructs and maintains steel bulk liquid storage tanks for a number of industries. This is a relatively small company with a market cap. of just over $25m, hence not a business we can invest in without causing a meaningful move in the price.
Technically the stock is in a clear downtrend, but is sitting in the 40-50c support area, a trader might consider buying with a stop under 40c, but this is aggressive / volatile stuff!
Saunders International (SND) Monthly Chart
Question 5
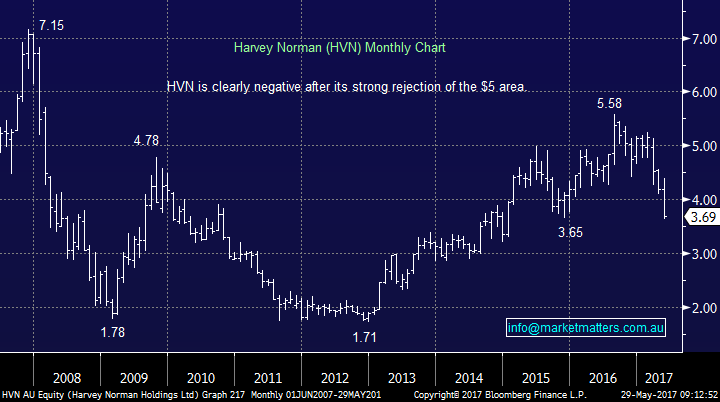
“With (potentially) rising bond rates and the onset of Amazon possibly disrupting AREIT's do you see any opportunity left for investment in this area in the current climate or would you rather wait and watch?” – Thanks, Peter.
Hi Peter, thanks for a simple question this morning! We have touched on this topic a number of times over recent weeks.
We have no interest in investing via the retail sector until further notice, with the following 2 factors at the forefront of our decision.
1. Australians are closing their wallets as confidence in the economy wanes.
2. The much publicised impact of Amazon remains hard to gauge.
Harvey Norman (HVN) Monthly Chart
Overnight Market Matters Wrap
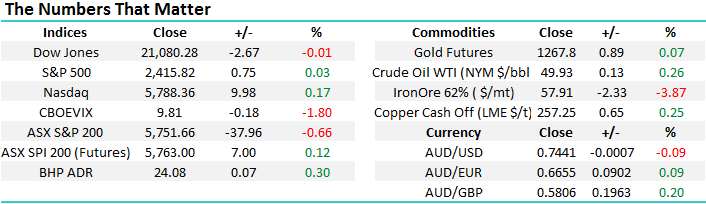
· The US share indices closed with little change last Friday, as investors sit on the sideline ahead of their long weekend, as well as the UK and China.
· Iron Ore lost 3.87%, as China remains closed until Wednesday, however BHP in the US indicates an outperformance against the broader market today after ending its session up an equivalent of +0.30% from Australia’s previous close.
· The June SPI Futures is indicating the ASX 200 to open 8 points higher, towards the 5760 level this morning.
Disclosure
Market Matters may hold stocks mentioned in this report. Subscribers can view a full list of holdings on the website by clicking here. Positions are updated each Friday.
Disclaimer
All figures contained from sources believed to be accurate. Market Matters does not make any representation of warranty as to the accuracy of the figures and disclaims any liability resulting from any inaccuracy. Prices as at 29/05/2017. 8.38AM.
Reports and other documents published on this website and email (‘Reports’) are authored by Market Matters and the reports represent the views of Market Matters. The MarketMatters Report is based on technical analysis of companies, commodities and the market in general. Technical analysis focuses on interpreting charts and other data to determine what the market sentiment about a particular financial product is, or will be. Unlike fundamental analysis, it does not involve a detailed review of the company’s financial position.
The Reports contain general, as opposed to personal, advice. That means they are prepared for multiple distributions without consideration of your investment objectives, financial situation and needs (‘Personal Circumstances’). Accordingly, any advice given is not a recommendation that a particular course of action is suitable for you and the advice is therefore not to be acted on as investment advice. You must assess whether or not any advice is appropriate for your Personal Circumstances before making any investment decisions. You can either make this assessment yourself, or if you require a personal recommendation, you can seek the assistance of a financial advisor. Market Matters or its author(s) accepts no responsibility for any losses or damages resulting from decisions made from or because of information within this publication. Investing and trading in financial products are always risky, so you should do your own research before buying or selling a financial product.
The Reports are published by Market Matters in good faith based on the facts known to it at the time of their preparation and do not purport to contain all relevant information with respect to the financial products to which they relate. Although the Reports are based on information obtained from sources believed to be reliable, Market Matters does not make any representation or warranty that they are accurate, complete or up to date and Market Matters accepts no obligation to correct or update the information or opinions in the Reports.
If you rely on a Report, you do so at your own risk. Any projections are estimates only and may not be realised in the future. Except to the extent that liability under any law cannot be excluded, Market Matters disclaims liability for all loss or damage arising as a result of any opinion, advice, recommendation, representation or information expressly or impliedly published in or in relation to this report notwithstanding any error or omission including negligence.
To unsubscribe. Click Here


