Subscriber’s questions
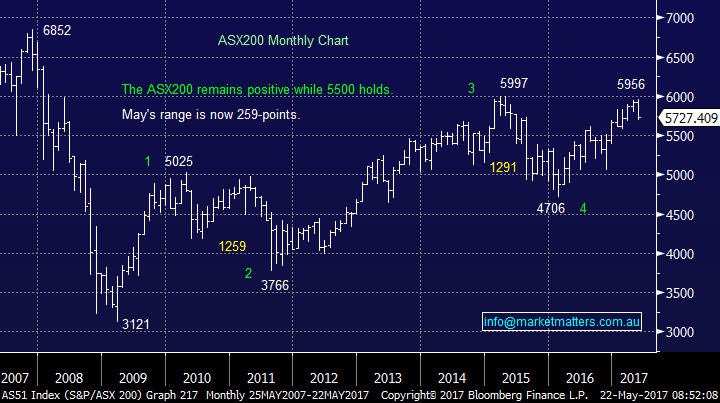
Further mixed political noise over the weekend surrounding Donald Trump’s connections to Russia and the sacking of FBI Director James Comey is likely to provide plenty of ongoing volatility for equity markets this week. We really shouldn’t be surprised that markets are trading erratically, recall we have been saying over recent weeks the average pullback since the GFC over May/June is 6.9%, which eventually targets ~5550 for the ASX200. Hence investors should take a deep breath and read the news from an interest perspective while remembering economics and company fundamentals drive markets / stocks, however short-term news does often provide excellent opportunities if one does not become a ‘deer in the headlights’.
ASX200 Monthly Chart
When you stand back and look at the US S&P500 on a monthly basis the 8-year bull market is very clear as is the relative quiet during the last 3-months, even including the 372-point fall from the Dow last Wednesday. We continue to focus on 3 main points:
1. We believe US stocks are in the their classic final “Phase 5” of the impressive bull market rally since March 2009.
2. Our ideal final target for this move is ~6-8% higher but we must all remain open-minded as our view is the advance is reaching maturity.
3. Ultimately we believe the market will correct back to its early 2016 lows, a correction of over 25%.
S&P500 Monthly Chart

Question 1
"Hi Guys, 1. Your weekend report pulled the plug on Regis what's the go with Newcrest now?
Good call on SIRTEX (SRX) last Monday.
2. Ramsay appears to be struggling to get any traction above $70 what are your thoughts. I like Eagers as a buy below $8 any thoughts on it.
Cheers
Lyle"
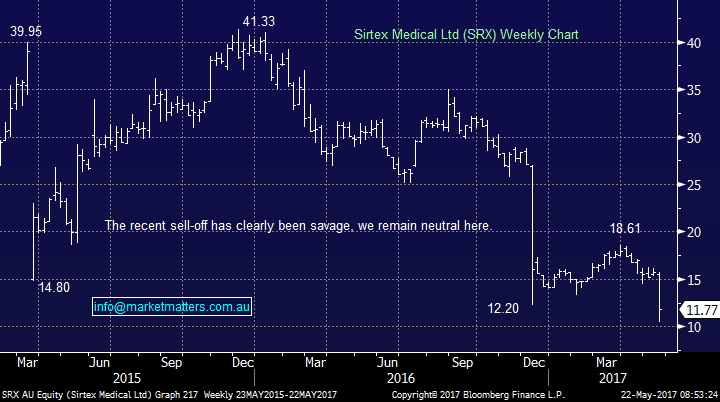
Hi, Lyle Some really interesting questions but as they cover lots of stocks please excuse the brevity as we are keen to cover each. Thanks on SRX, the technical picture worked here by keeping us away from a stock that has been under significant pressure since mid-2015. Over the last 12-months once a stock disappointed the market it has rarely been able to rapidly come back into favour, investors have lost all patience with underperforming operators!
In the case of SRX, last week’s large decline looks all too familiar given something similar played out in December of 2016. Using this as a guide, we saw the stock snap back from the initial destruction before trading sideways for the next 6 months. Although we see now think Sirtex is interesting, with some clear speculative appeal, the stock is only for the brave.
Siretx (SRX) Weekly Chart
We have discussed Regis Resources (RRL) and Newcrest Mining (NCM) in more detail in question 3 but in simple language we are looking for optimum levels to increase our gold sector exposure.
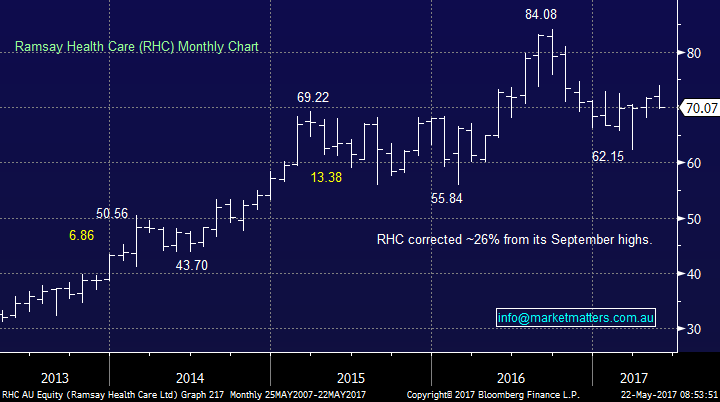
We took profit on our RHC position above $70.50 about a month ago, the stock did rally a few more percent but we are comfortable having liquidated this position. We believe RHC is a great company but trading on a multiple of 26.6x based on 2017 earnings leaves plenty of room for disappointment and the technical picture suggests a pullback towards ~$55 is a strong possibility.
Ramsay Healthcare (RHC) Monthly Chart
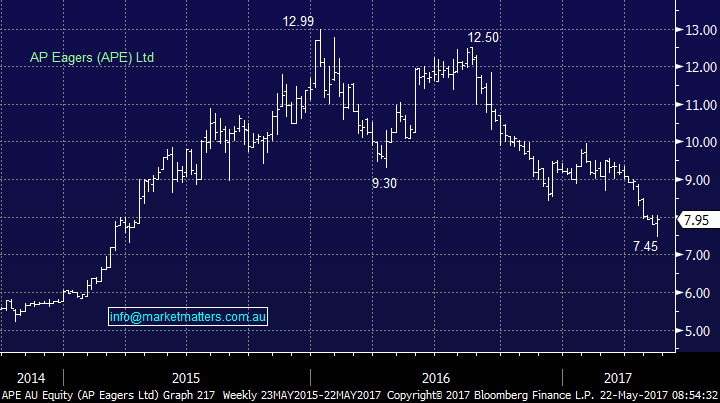
AP Eagers is a QLD based company who sells new and used motor vehicles plus distributing related parts and accessories, not a stock we follow particularly closely. There are however some interesting aspects to this stock, the first of which is thinking about what supports new car sales. Obviously a number of factors however one of the big drivers is the cost of finance. Over the past year or so, it has made sense to trade in an older vehicle bought at a time when finance was more expensive, and purchased a new vehicle to lock in a lower rates for the next 3-5 years. This has helped to support new vehicle sales in Australia and abroad (particularly in the States). This trend is starting to change and the cost of funding has risen (despite the RBA sitting on its hands). In terms of APE specifically, this is a company that looks good on paper. Uninterrupted profit growth, reliable dividends and a reasonable multiple (14.3x) , however it is a stock that will be hit hard if the economy starts to struggle and interest rates tick higher given the likely drop in new vehicle sales.
AP Eagers Ltd (APE) Weekly Chart
Question 2
“Hi team, I own FXJ around $1.00. Value your thoughts here on whether I should sell some/all of my holding, or hold for higher TPG offer” - Thanks Jeff.
Hi Jeff, very importantly we cannot give personal advice hence our comments on FXJ are on a purely overview level.
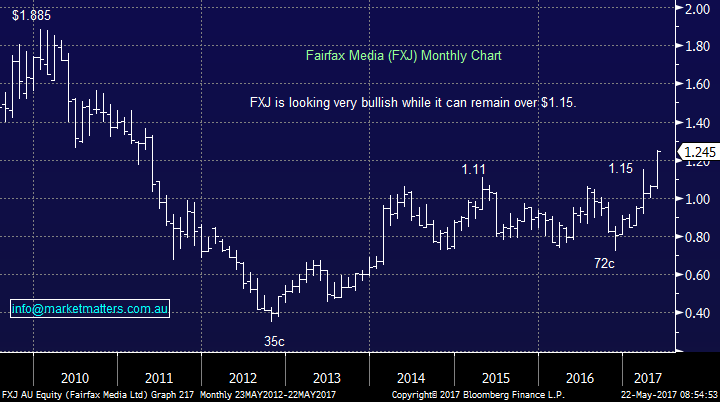
1. We became bullish FXJ under $1 mentioning the stock in a few reports, but unfortunately we did not go long for the MM portfolio.
2. A healthy bidding war is unfolding for FXJ as the suitors attempt to purchase the Domain Group, owned by FXJ, plus a couple of the better mast heads
3. While we believe this bidding war has further to unravel, after rallying ~25% we would be inclined to take a profit on ~1/3 of our position in FXJ “IF” we had gone long when we flagged the opportunity.
Fairfax (FXJ) Monthly Chart
Question 3
“Hi Fellows, Was MM aware of the earthquake that hit NCM’s Cadia Mine before nominating NCM as a “buy”? ”-Regards, John.
Morning John, Both our Newcrest Mining (NCM) and gold stance are interesting at present, thanks for the topical question.
1. We allocated 5% of the MM portfolio into NCM on the 18th of April at $23.95.
2. We had not long before enjoyed profitable trades in both NCM and EVN within the gold space.
3. Our plan at the time was to accumulate NCM and RRL into anticipated weakness.
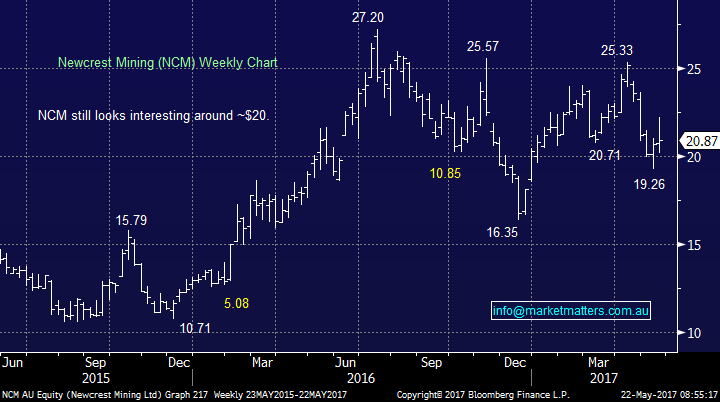
When we allocated the 5% into NCM we were aware of the earthquake at Cadia using the subsequent weakness it created to buy. Our initial view was the damage would not be too detrimental long term, the stock held together for the next 4-5 days before falling ~15%, more on weakness in the overall gold space. Our assessment of the long-term damage has proven accurate as the news last Thursday showed shorter downtime than the market seemed to be positioned for and the stock popped 5% higher.
However the position remains clearly underwater but it’s now more of a sector issue than stock specific with RRL ~12% below its April high. We still intend to accumulate further NCM and RRL but short-term the sector feels heavy so we are maintaining patience.
Watch for alerts as we may alter our entry levels as new information comes to light.
Newcrest Mining (NCM) Weekly Chart
Question 4
”Re Westfield and the influence of Amazon on the Australian market, as I understand it WFD does not operate in the local market? They spun off their AU/NZ assets into SCG a couple of years ago.” - Cheers, Rob.
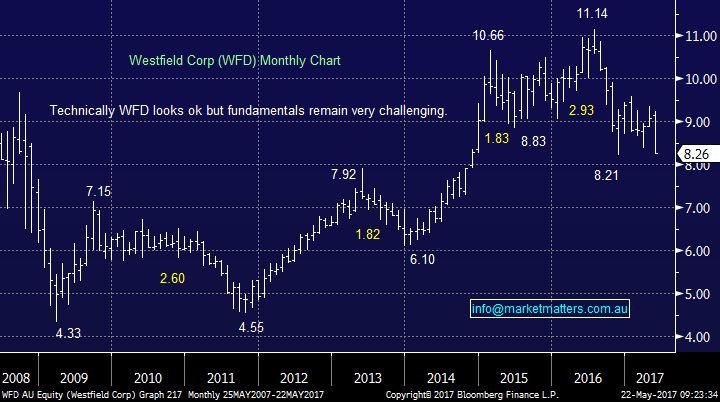
Hi Rob, your absolutely right, the main retail landlords in Australia include SCG, VCX and SCP. We typically stay in the most liquid in the sector hence our reference to WFD, however as has been rightly pointed out, their exposure lies in the US. Our note last week does sound incorrect on reflection, however we were trying (unsuccessfully as it turns out) to tie in our last trade in the sector with our current thoughts, overall a poor note and we apologise. Also, we wanted to illustrate how we would ignore a technical picture if the fundamentals felt wrong.
However we do stick with our view that we do not have any interest in local, or overseas, traditional retail stocks at present which clearly does influence our thoughts towards WFD.
Westfield Corp. (WFD) Monthly Chart
Question 5
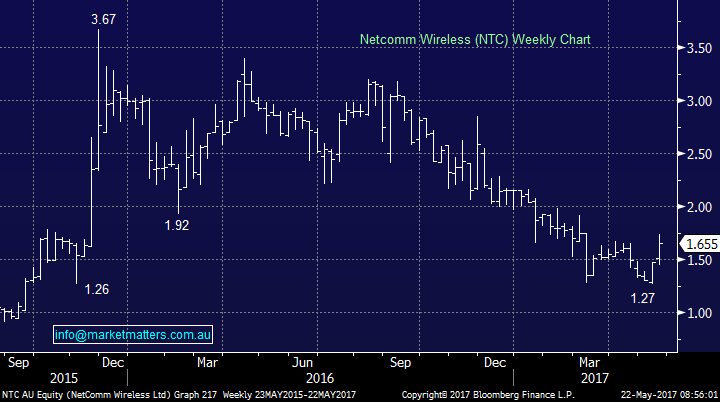
"Hi, What do you guys think of NTC chart ?” – Thanks Peter.
Morning Peter, thanks for the question. Sydney based NetComm Wireless designs, manufactures and distributes communication and networking devices and is a stock MM has not mentioned previously primarily due to its size, it only traded 177,000 shares last Friday – it would be very hard for MM to buy / sell this stock without moving the price too much.
NTC is clearly a volatile stock regularly moving well over 15% in one week. Technically the stock looks good and is due a $1 bounce but we will not / cannot play in this space.
NetComm Wireless (NTC) Weekly Chart
Question 6
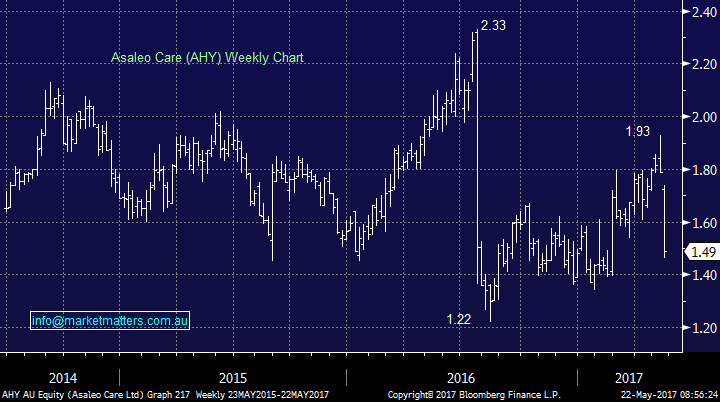
“Hi Guys, With big price declines and recent downgrades pushed upon AHY is there an opportunity here soon for a mispriced quality stock?” – Peter.
Morning Peter, Thanks for taking us out of our comfort zone! The personal care and hygiene company Asaleo Care (AHY) is a stock we don’t really follow but it’s certainly been under pressure in 2016. Trading on a yield of 6.7% and a valuation of only 12.4x looks attractive on the surface but the market clearly Slowing ‘top line’ yet it seems fixed costs remain elevated casts a shadow over the future of this business.
Broker ratings of AHY
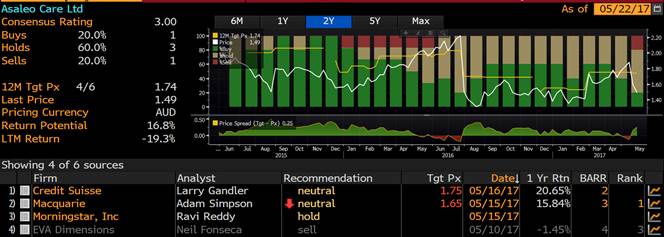
Furthermore, this is a stock that reminds of the previously touched on SRX having disappointed investors in a major way twice within 18-months. There is a saying with professionals within the market “buy the 3rd downgrade” this feels very applicable to AHY and we would be patient from a buying perspective at this stage.
Asaleo Care (AHY) Weekly Chart
Overnight Market Matters Wrap
· All major US equity markets finished their week off in positive territory, albeit in down for the week.
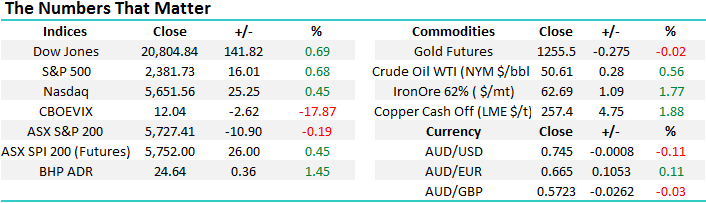
· The commodities sector will remain as the flavour of the month, with reports all members of the OPEC agreeing to maintaining current low production amounts out until 2018, while Iron Ore rallied 1.77%.
· BHP is expected to outperform the broader market, after its last US session rally equivalent of 1.45% to $24.64 from Australia’s previous close.
· The June SPI Futures is indicating the ASX 200 to open 20 points higher, testing the 5950 level this morning.
Disclosure
Market Matters may hold stocks mentioned in this report. Subscribers can view a full list of holdings on the website by clicking here. Positions are updated each Friday.
Disclaimer
All figures contained from sources believed to be accurate. Market Matters does not make any representation of warranty as to the accuracy of the figures and disclaims any liability resulting from any inaccuracy. Prices as at 22/05/2017. 8.00AM.
Reports and other documents published on this website and email (‘Reports’) are authored by Market Matters and the reports represent the views of Market Matters. The MarketMatters Report is based on technical analysis of companies, commodities and the market in general. Technical analysis focuses on interpreting charts and other data to determine what the market sentiment about a particular financial product is, or will be. Unlike fundamental analysis, it does not involve a detailed review of the company’s financial position.
The Reports contain general, as opposed to personal, advice. That means they are prepared for multiple distributions without consideration of your investment objectives, financial situation and needs (‘Personal Circumstances’). Accordingly, any advice given is not a recommendation that a particular course of action is suitable for you and the advice is therefore not to be acted on as investment advice. You must assess whether or not any advice is appropriate for your Personal Circumstances before making any investment decisions. You can either make this assessment yourself, or if you require a personal recommendation, you can seek the assistance of a financial advisor. Market Matters or its author(s) accepts no responsibility for any losses or damages resulting from decisions made from or because of information within this publication. Investing and trading in financial products are always risky, so you should do your own research before buying or selling a financial product.
The Reports are published by Market Matters in good faith based on the facts known to it at the time of their preparation and do not purport to contain all relevant information with respect to the financial products to which they relate. Although the Reports are based on information obtained from sources believed to be reliable, Market Matters does not make any representation or warranty that they are accurate, complete or up to date and Market Matters accepts no obligation to correct or update the information or opinions in the Reports.
If you rely on a Report, you do so at your own risk. Any projections are estimates only and may not be realised in the future. Except to the extent that liability under any law cannot be excluded, Market Matters disclaims liability for all loss or damage arising as a result of any opinion, advice, recommendation, representation or information expressly or impliedly published in or in relation to this report notwithstanding any error or omission including negligence.
To unsubscribe. Click Here


